

Question: Given the data below and using Excel, construct the histogram labeling the USL, LSL, and X bar Specifications 6.00+ 0.05 Measurement 3 Measurement 1 Measurement
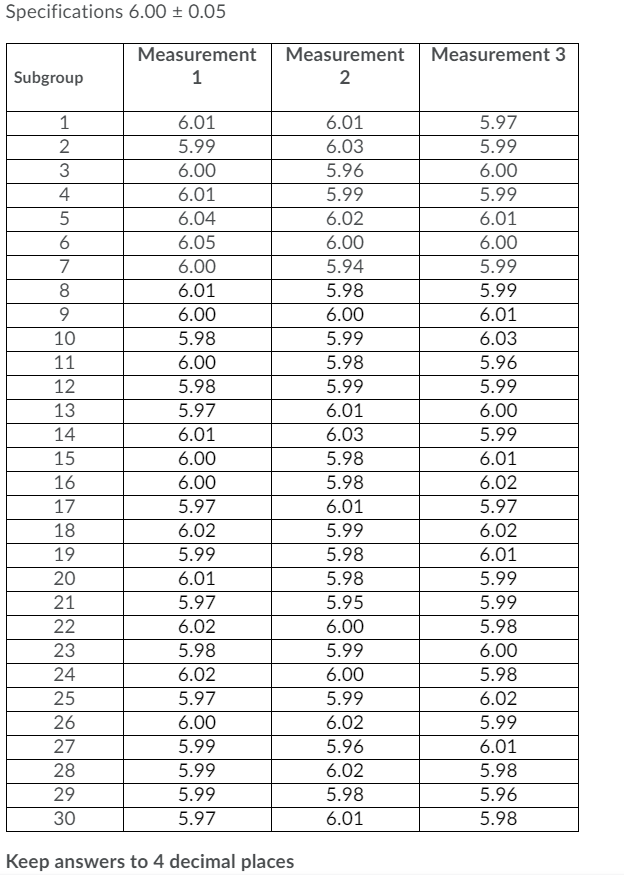
Given the data below and using Excel, construct the histogram labeling the USL, LSL, and Xbar
Specifications 6.00+ 0.05 Measurement 3 Measurement 1 Measurement 2 Subgroup 1 2 3 4 5 6 7 8 9 10 11 12 13 14 15 16 17 18 19 20 21 22 23 24 25 26 27 28 29 30 6.01 5.99 6.00 6.01 6.04 6.05 6.00 6.01 6.00 5.98 6.00 5.98 5.97 6.01 6.00 6.00 5.97 6.02 5.99 6.01 5.97 6.02 5.98 6.02 5.97 6.00 5.99 5.99 5.99 5.97 6.01 6.03 5.96 5.99 6.02 6.00 5.94 5.98 6.00 5.99 5.98 5.99 6.01 6.03 5.98 5.98 6.01 5.99 5.98 5.98 5.95 6.00 5.99 6.00 5.99 6.02 5.96 6.02 5.98 6.01 5.97 5.99 6.00 5.99 6.01 6.00 5.99 5.99 6.01 6.03 5.96 5.99 6.00 5.99 6.01 6.02 5.97 6.02 6.01 5.99 5.99 5.98 6.00 5.98 6.02 5.99 6.01 5.98 5.96 5.98 Keep answers to 4 decimal placesStep by Step Solution
There are 3 Steps involved in it
1 Expert Approved Answer
Step: 1 Unlock

Question Has Been Solved by an Expert!
Get step-by-step solutions from verified subject matter experts
Step: 2 Unlock
Step: 3 Unlock