

Question: Given the data below, calculate the expected return and standard deviation for each individual stock and for a portfolio that is constructed by investing 50%
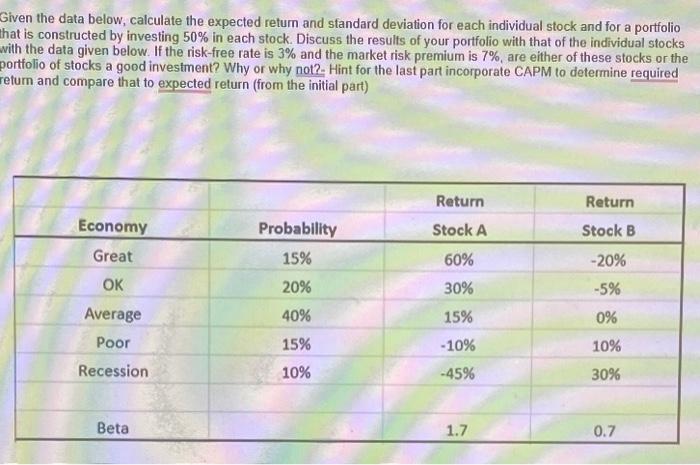
Given the data below, calculate the expected return and standard deviation for each individual stock and for a portfolio that is constructed by investing 50% in each stock. Discuss the results of your portfolio with that of the individual stocks with the data given below. If the risk-free rate is 3% and the market risk premium is 7%, are either of these stocks or the portfolio of stocks a good investment? Why or why not?- Hint for the last part incorporate CAPM to determine required return and compare that to expected return (from the initial part) Economy Great OK Average Poor Recession Beta Probability 15% 20% 40% 15% 10% Return Stock A 60% 30% 15% -10% -45% 1.7 Return Stock B -20% -5% 0% 10% 30% 0.7
Step by Step Solution
There are 3 Steps involved in it

Get step-by-step solutions from verified subject matter experts