

Question: - Given the data below, create appropriate visuals for insertion into a technical document or presentation for each data set. Use Excel to create your
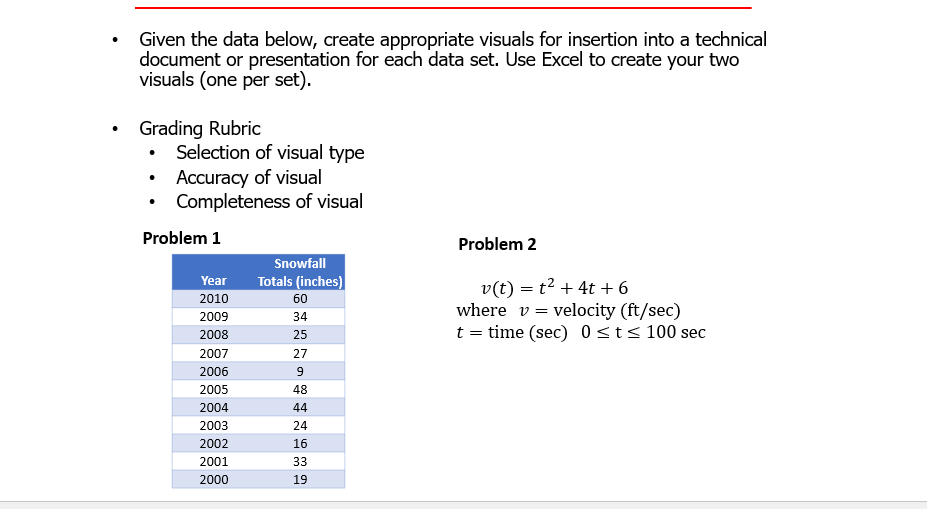
- Given the data below, create appropriate visuals for insertion into a technical document or presentation for each data set. Use Excel to create your two visuals (one per set). - Grading Rubric - Selection of visual type - Accuracy of visual - Completeness of visual Problem 1 Problem 2 v(t)=t2+4t+6wherev=velocity(ft/sec)t=time(sec)0t100sec
Step by Step Solution
There are 3 Steps involved in it
1 Expert Approved Answer
Step: 1 Unlock

Question Has Been Solved by an Expert!
Get step-by-step solutions from verified subject matter experts
Step: 2 Unlock
Step: 3 Unlock