

Question: Given the data below, prepare a Cost-Schedule Integration chart to show the planned progress (% complete) and budget; as discussed in the onscreen modules. Month
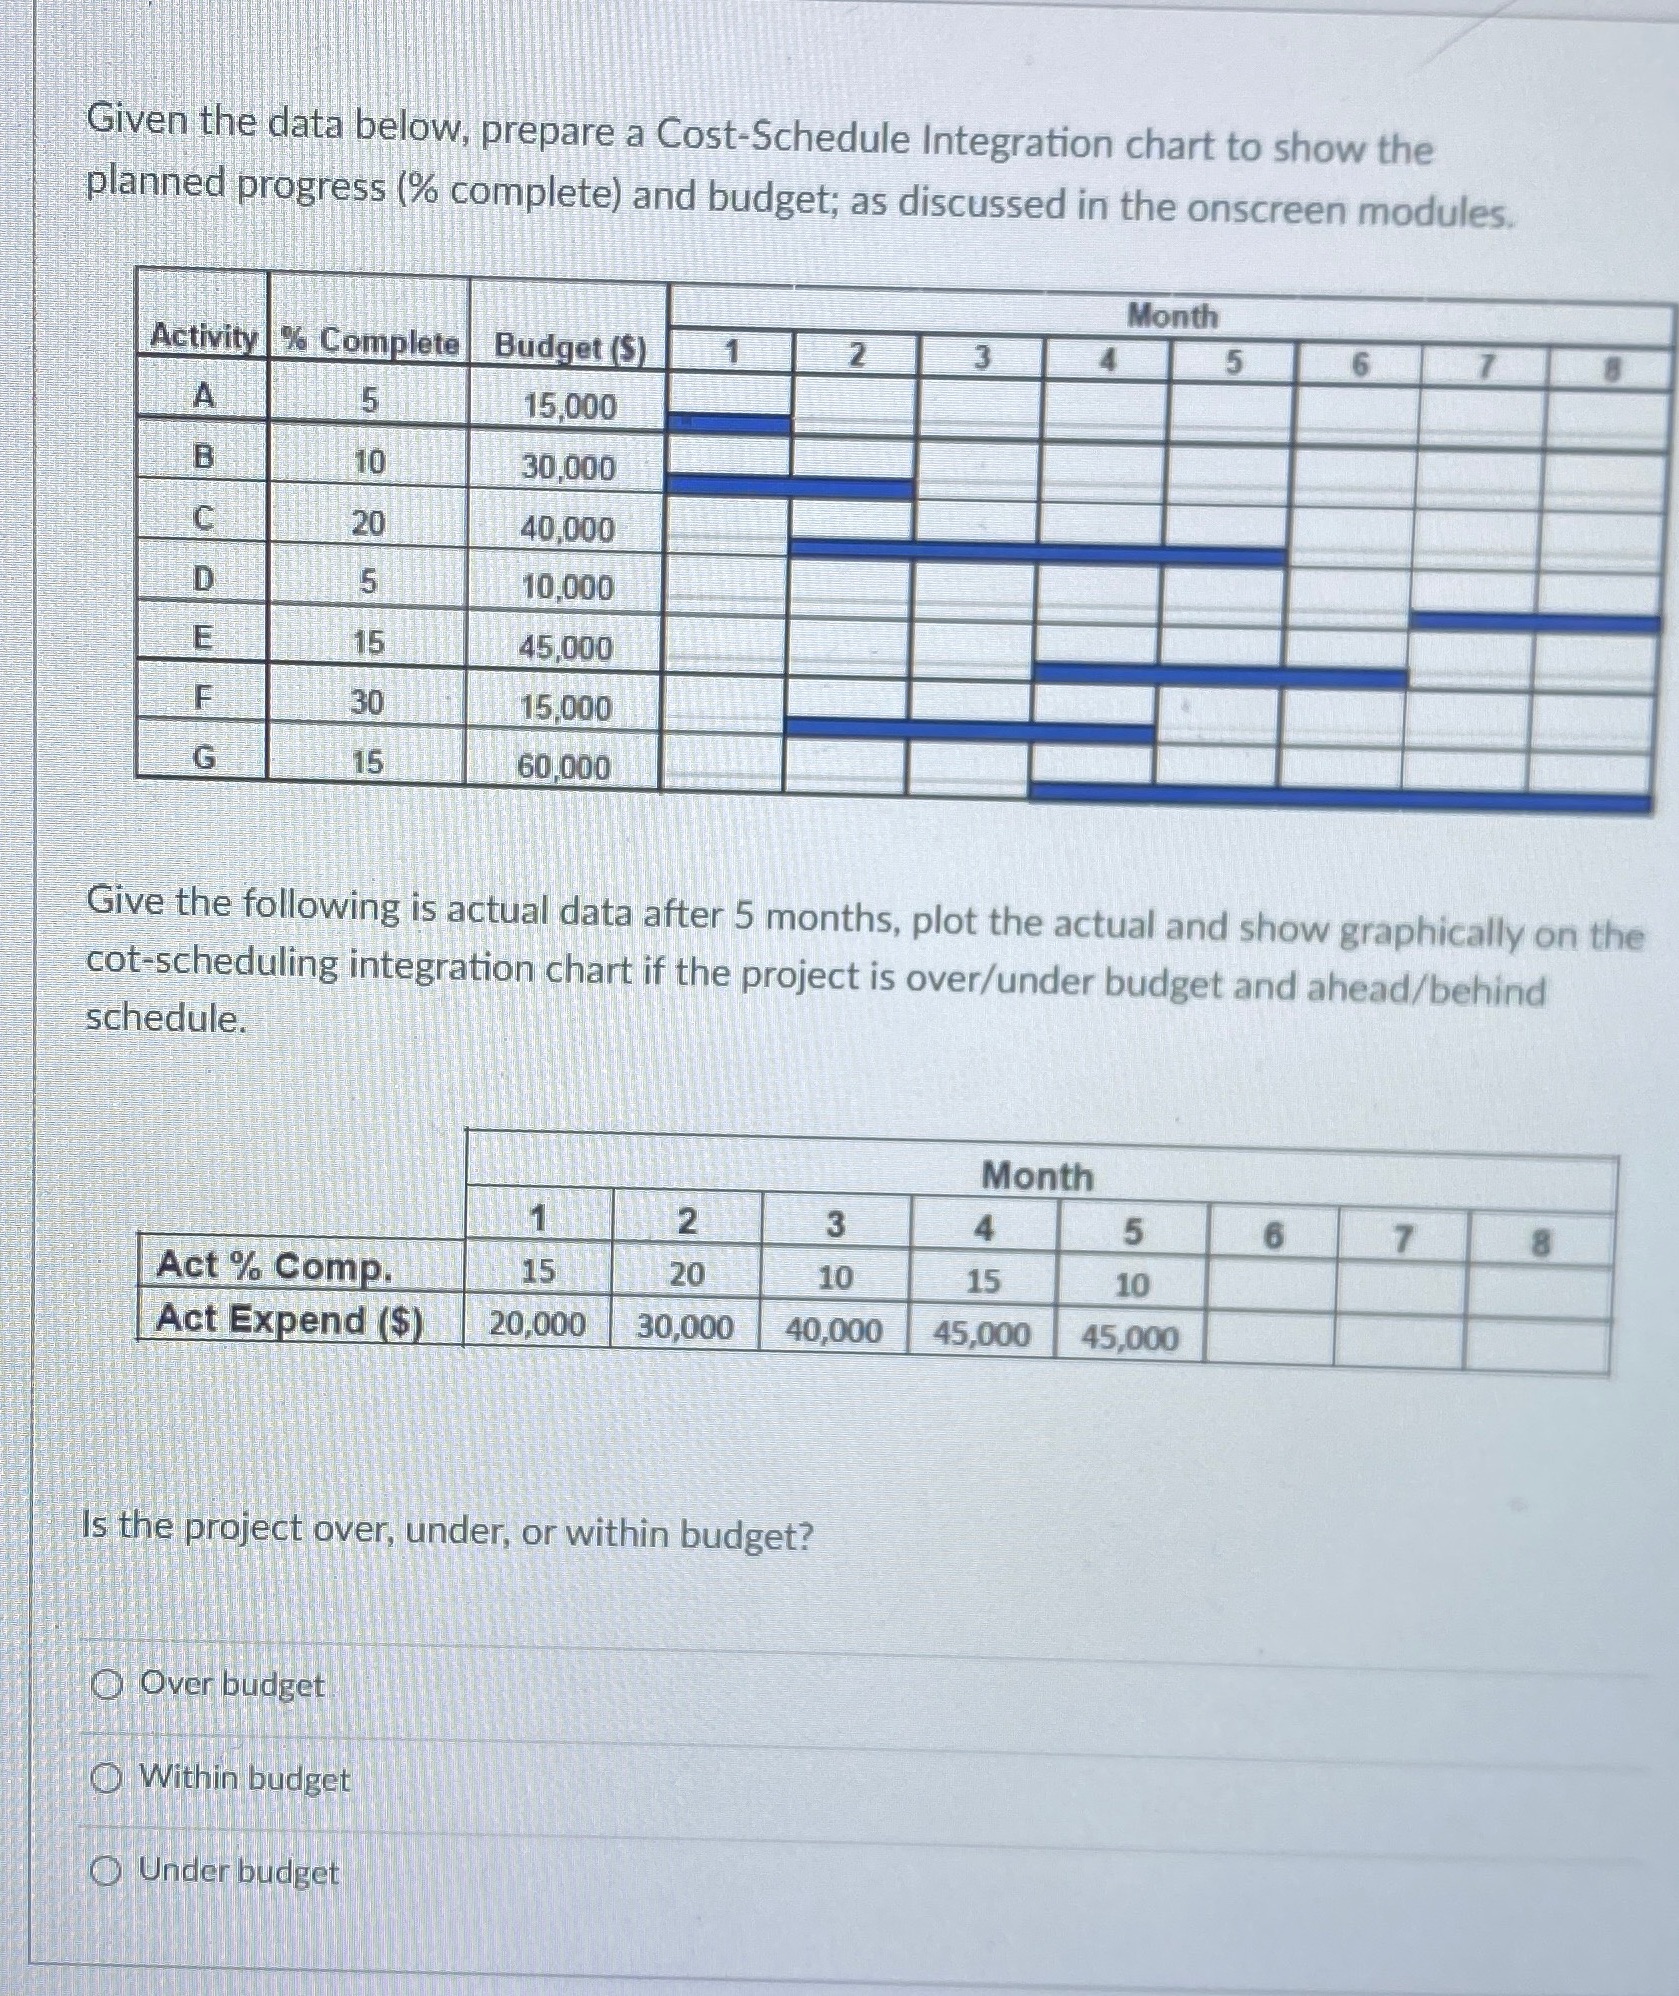
Given the data below, prepare a Cost-Schedule Integration chart to show the planned progress (% complete) and budget; as discussed in the onscreen modules. Month Activity |% Complete Budget ($) 5 6 5 15,000 B 10 30,000 C 20 40,000 D 5 10.000 E 15 45,000 30 15,000 G 15 60,000 Give the following is actual data after 5 months, plot the actual and show graphically on the cot-scheduling integration chart if the project is over/under budget and ahead/behind schedule. Month 2 5 6 7 Act % Comp. 15 20 10 15 10 Act Expend ($) 20,000 30,000 40,000 45,000 45,000 Is the project over, under, or within budget? Over budget Within budget Under budget
Step by Step Solution
There are 3 Steps involved in it
1 Expert Approved Answer
Step: 1 Unlock

Question Has Been Solved by an Expert!
Get step-by-step solutions from verified subject matter experts
Step: 2 Unlock
Step: 3 Unlock