

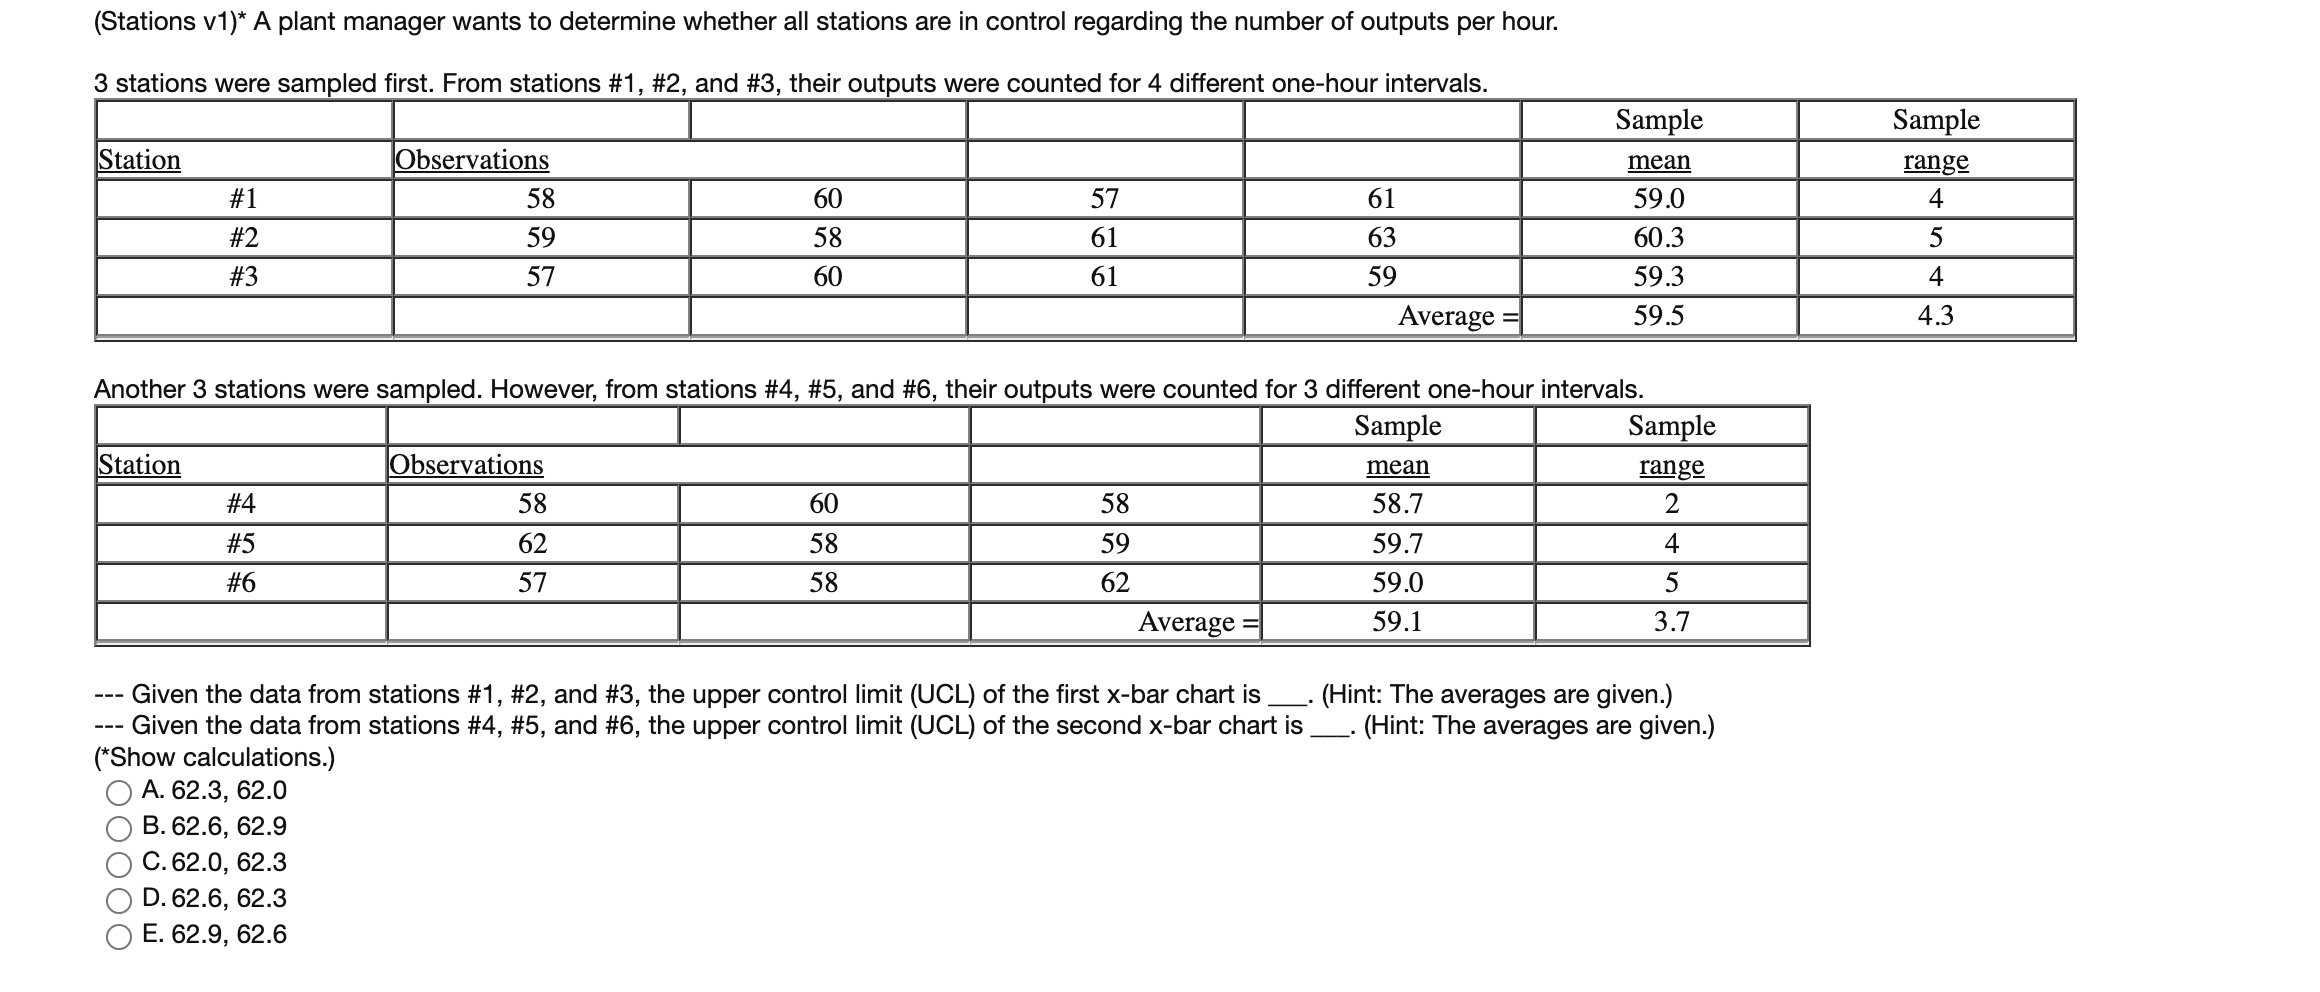
Question: - Given the data from stations #1, #2, and #3, the upper control limit (UCL) of the first x-bar chart is (Hint: The averages are
Step by Step Solution
There are 3 Steps involved in it
1 Expert Approved Answer
Step: 1 Unlock

Question Has Been Solved by an Expert!
Get step-by-step solutions from verified subject matter experts
Step: 2 Unlock
Step: 3 Unlock