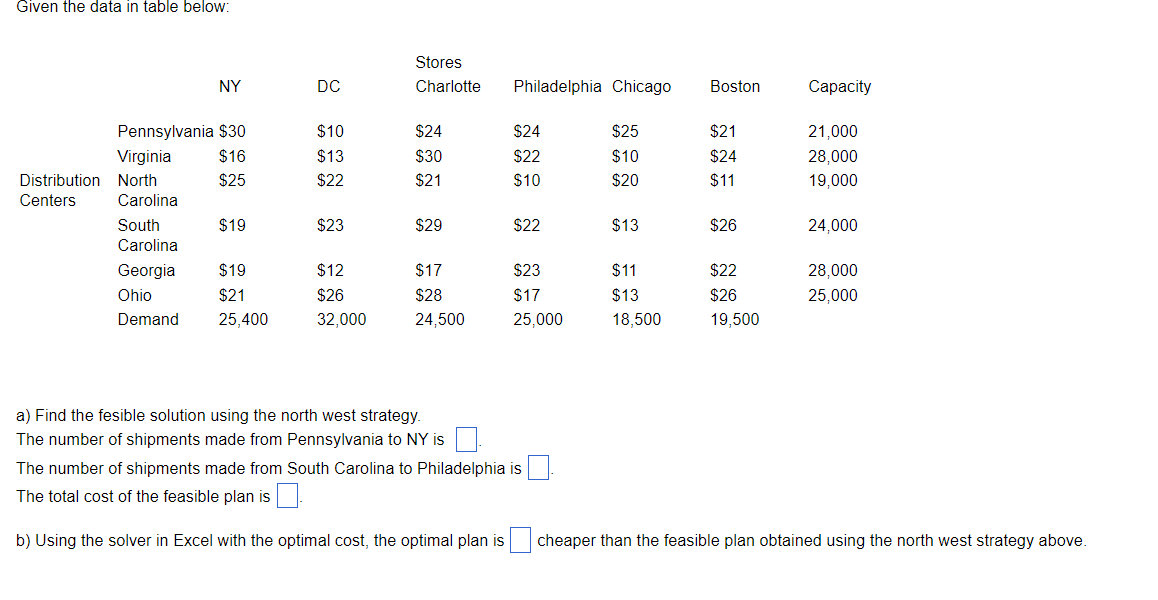
Question: Given the data in table below: Stores Charlotte NY DC Philadelphia Chicago Boston Capacity $10 $13 $22 $24 $30 $21 S24 S22 $10 $25 $10

Given the data in table below: Stores Charlotte

Given the data in table below: Stores Charlotte NY DC Philadelphia Chicago Boston Capacity $10 $13 $22 $24 $30 $21 S24 S22 $10 $25 $10 $20 $21 $24 $11 21,000 28,000 19,000 Pennsylvania $30 Virginia $16 Distribution North $25 Centers Carolina South $19 Carolina Georgia $19 Ohio $21 Demand 25,400 $23 $29 $22 $13 $26 24,000 $12 $26 32,000 $17 $28 24,500 $23 $17 25,000 $11 $13 18.500 $22 $26 19,500 28,000 25,000 a) Find the fesible solution using the north west strategy. The number of shipments made from Pennsylvania to NY is The number of shipments made from South Carolina to Philadelphia is The total cost of the feasible plan is I b) Using the solver in Excel with the optimal cost, the optimal plan is cheaper than the feasible plan obtained using the north west strategy above

Step by Step Solution

There are 3 Steps involved in it

1 Expert Approved Answer
Step: 1 Unlock blur-text-image
Question Has Been Solved by an Expert!

Get step-by-step solutions from verified subject matter experts

Step: 2 Unlock
Step: 3 Unlock

Students Have Also Explored These Related General Management Questions!