

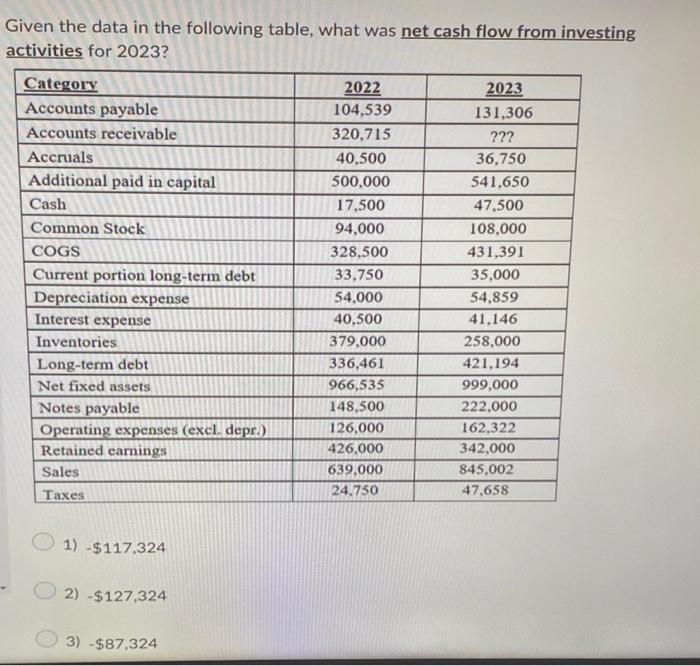
Question: Given the data in the following table, what was net cash flow from investing activities for 2023? Category Accounts payable Accounts receivable Accruals Additional paid
Given the data in the following table, what was net cash flow from investing activities for 2023? Category Accounts payable Accounts receivable Accruals Additional paid in capital Cash Common Stock COGS Current portion long-term debt Depreciation expense Interest expense Inventories Long-term debt Net fixed assets Notes payable Operating expenses (excl. depr.) Retained earnings Sales Taxes 1) -$117,324 2) -$127,324 3) -$87,324 2022 104,539 320,715 40,500 500,000 17,500 94,000 328,500 33,750 54,000 40,500 379,000 336,461 966,535 148,500 126,000 426,000 639,000 24,750 2023 131,306 ??? 36,750 541,650 47,500 108,000 431,391 35,000 54,859 41,146 258,000 421,194 999,000 222,000 162,322 342,000 845,002 47,658
Given the data in the following table, what was net cash flow from investing activities for 2023 ? 1) $117,324 2) $127,324 3) $87,324
Step by Step Solution
There are 3 Steps involved in it
1 Expert Approved Answer
Step: 1 Unlock

Question Has Been Solved by an Expert!
Get step-by-step solutions from verified subject matter experts
Step: 2 Unlock
Step: 3 Unlock