

Question: Given the data in the table below, evaluate each of the forecasting methods listed in parts a through d below. To do so, use the
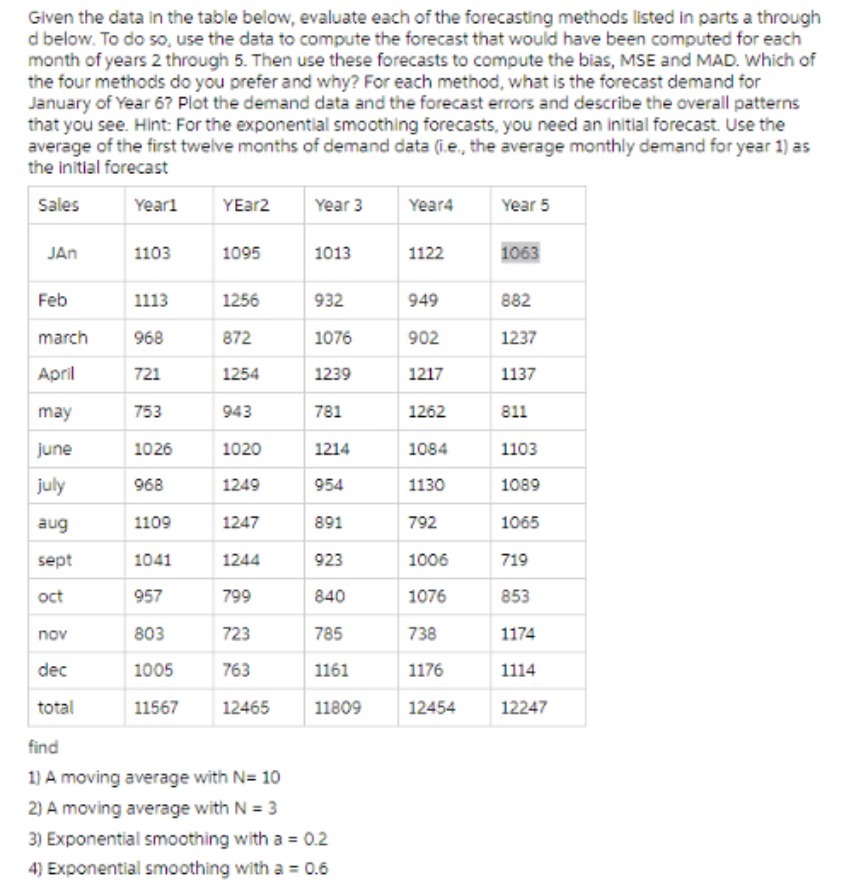
Given the data in the table below, evaluate each of the forecasting methods listed in parts a through d below. To do so, use the data to compute the forecast that would have been computed for each month of years 2 through 5. Then use these forecasts to compute the bias, MSE and MAD. Which of the four methods do you prefer and why? For each method, what is the forecast demand for January of Year 67 Plot the demand data and the forecast errors and describe the overall patterns that you see. Hint: For the exponential smoothing forecasts, you need an initial forecast. Use the average of the first twelve months of demand data (i.e., the average monthly demand for year 1) as the initial forecast Sales Yearl YEar2 Year 3 Year4 Year 5 JAn 1103 1095 1013 1122 1063 Feb 1113 1256 932 949 882 march 968 872 1076 902 1237 April 721 1254 1239 1217 1137 may 753 943 781 1262 811 june 1026 1020 1214 1084 1103 july 968 1249 954 1130 1089 aug 1109 1247 891 792 1065 sept 1041 1244 923 1006 719 oct 957 799 840 1076 853 nov 803 723 785 738 1174 dec 1005 763 1161 1176 1114 total 11567 12465 11809 12454 12247 find 1) A moving average with N= 10 2) A moving average with N = 3 3) Exponential smoothing with a = 0.2 4) Exponential smoothing with a = 0.6
Step by Step Solution
There are 3 Steps involved in it

Get step-by-step solutions from verified subject matter experts