

Question: Given the data in the table below: X 25 35 45 50 55 60 70 y 2500 3550 4250 4900 5400 5500 6900f(1) Construct a
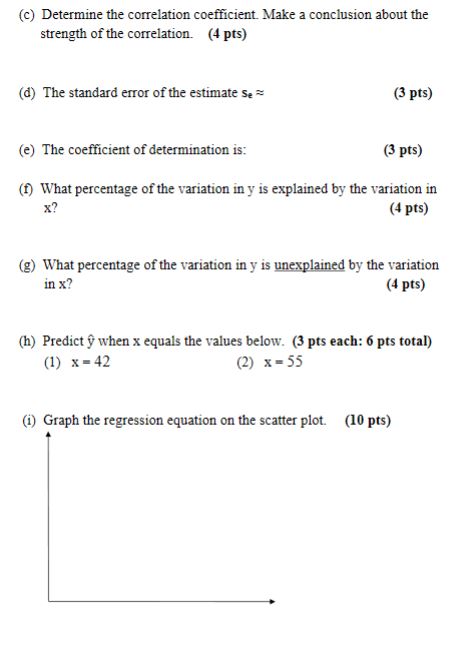

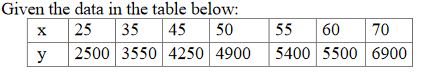

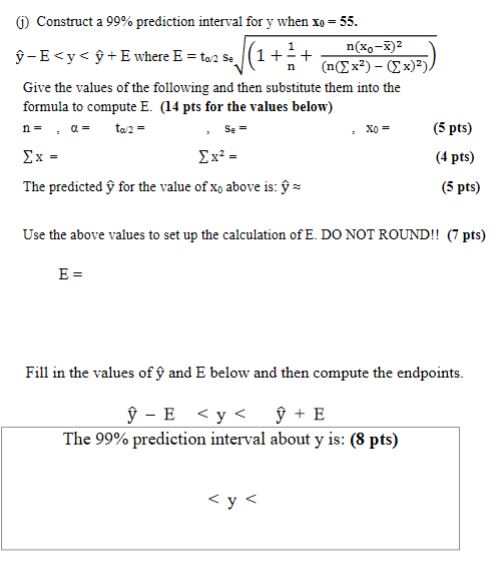
Given the data in the table below: X 25 35 45 50 55 60 70 y 2500 3550 4250 4900 5400 5500 6900\f(1) Construct a 99% prediction interval for y when xo = 55. 9 - E
Step by Step Solution
There are 3 Steps involved in it
1 Expert Approved Answer
Step: 1 Unlock

Question Has Been Solved by an Expert!
Get step-by-step solutions from verified subject matter experts
Step: 2 Unlock
Step: 3 Unlock