

Question: Given the data: Month Feb. Mar. Apr. May Jun. Jul. Aug. Sales (000 units) 19 18 15 20 18 22 20 1. Plot the
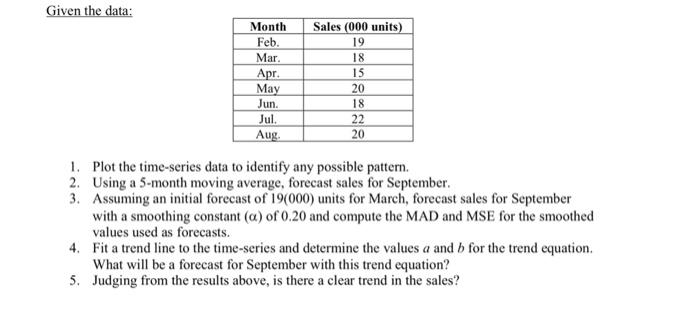
Given the data: Month Feb. Mar. Apr. May Jun. Jul. Aug. Sales (000 units) 19 18 15 20 18 22 20 1. Plot the time-series data to identify any possible pattern. 2. 3. Using a 5-month moving average, forecast sales for September. Assuming an initial forecast of 19(000) units for March, forecast sales for September with a smoothing constant (a) of 0.20 and compute the MAD and MSE for the smoothed values used as forecasts. 4. Fit a trend line to the time-series and determine the values a and b for the trend equation. What will be a forecast for September with this trend equation? 5. Judging from the results above, is there a clear trend in the sales?
Step by Step Solution
3.52 Rating (155 Votes )
There are 3 Steps involved in it
Here are the steps to answer the questions 1 Plot the timeseries data Feb Mar Apr May Jun Jul Aug 1... View full answer

Get step-by-step solutions from verified subject matter experts