

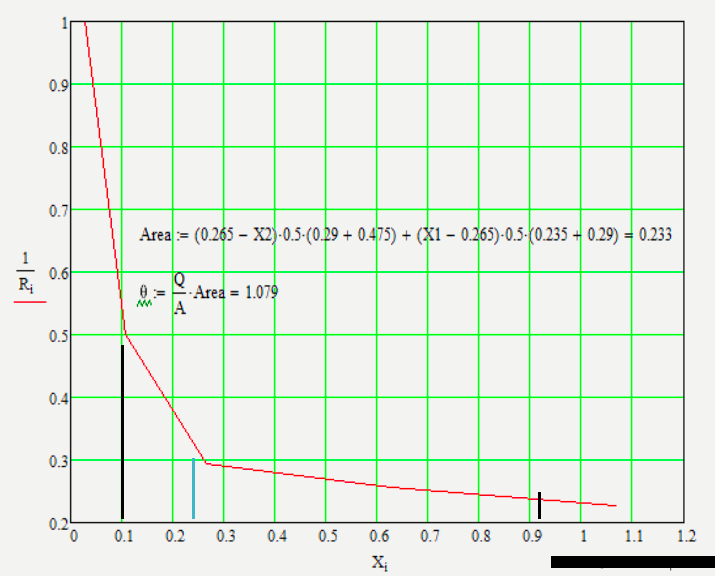
Question: Given the data points needed to plot the graph. How was area computed? please explain properly and how 0.233 was solved as the area of
Given the data points needed to plot the graph. How was area computed?
please explain properly and how 0.233 was solved as the area of the graph.
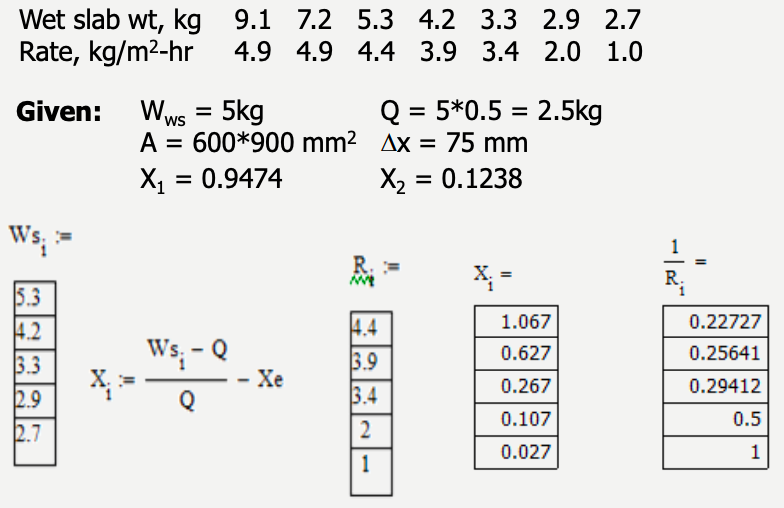
Wetslabwt,kgRate,kg/m2hr9.14.97.24.95.34.44.23.93.33.42.92.02.71.0 Given: Wws=5kgA=600900mm2X1=0.9474Q=50.5=2.5kgx=75mmX2=0.1238 Wsi:= \begin{tabular}{|l|} \hline 5.3 \\ \hline 4.2 \\ \hline 3.3 \\ \hline 2.9 \\ \hline 2.7 \\ \hline \end{tabular} Ri1= \begin{tabular}{|r|} \hline 0.22727 \\ \hline 0.25641 \\ \hline 0.29412 \\ \hline 0.5 \\ \hline 1 \\ \hline \end{tabular}
Step by Step Solution
There are 3 Steps involved in it
1 Expert Approved Answer
Step: 1 Unlock

Question Has Been Solved by an Expert!
Get step-by-step solutions from verified subject matter experts
Step: 2 Unlock
Step: 3 Unlock