

Question: Given the data shown below, use = 0 . 2 and = 0 . 4 to create a trend enhanced smoothing based forecast for period
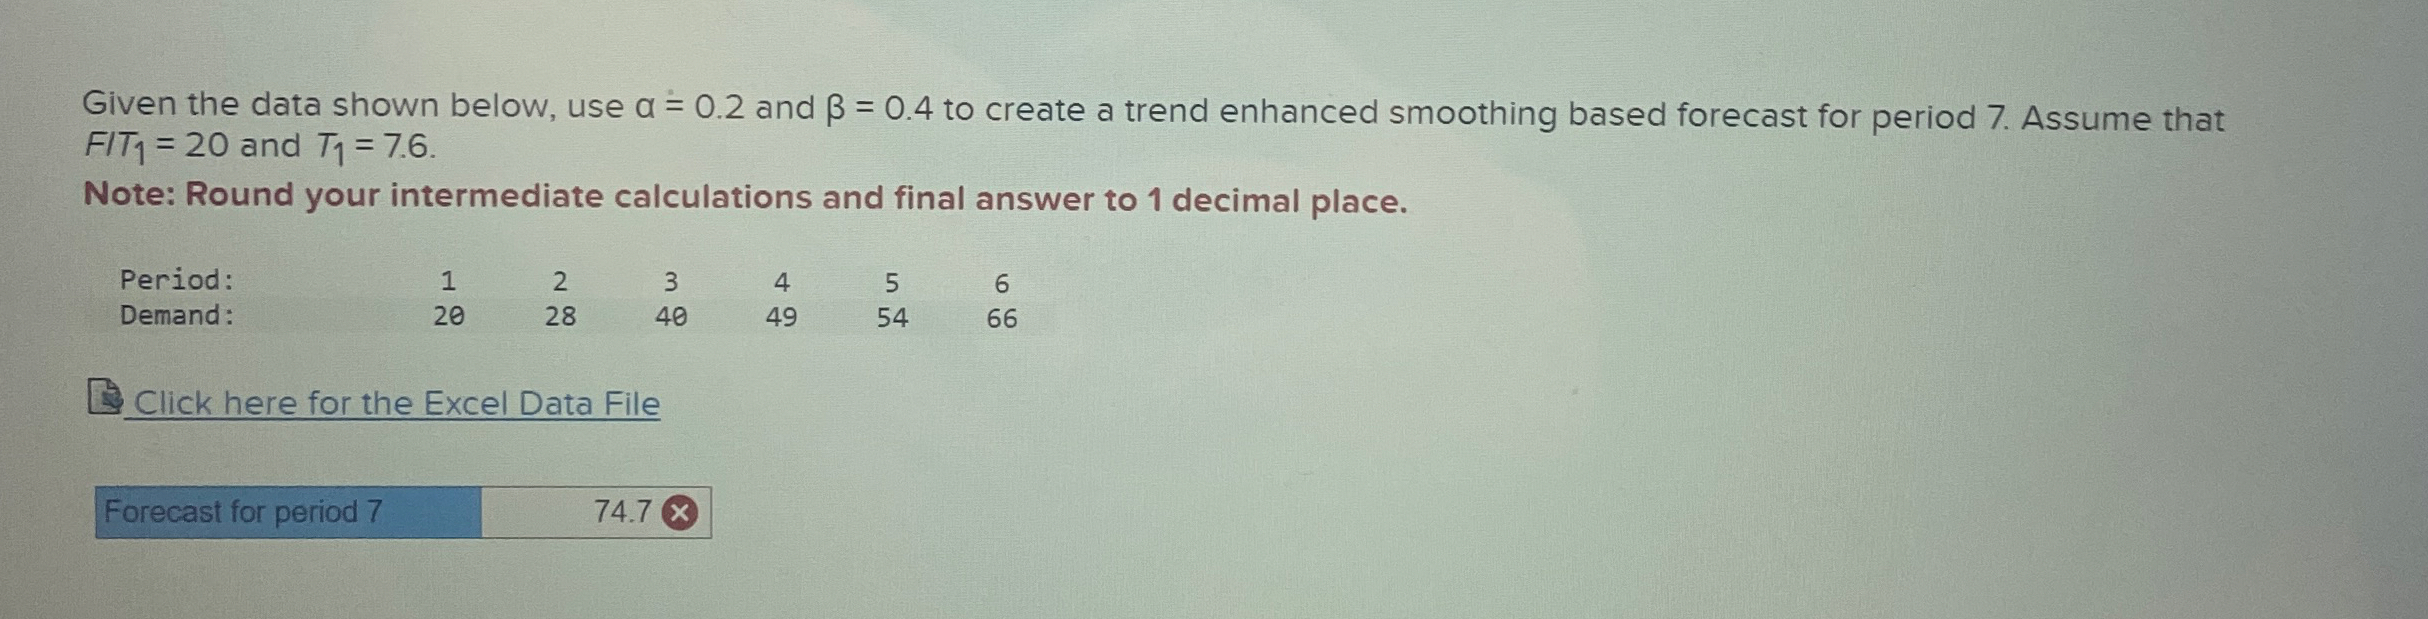
Given the data shown below, use and to create a trend enhanced smoothing based forecast for period Assume that and
Note: Round your intermediate calculations and final answer to decimal place.
Period:
table
Click here for the Excel Data File
Forecast for period
Step by Step Solution
There are 3 Steps involved in it
1 Expert Approved Answer
Step: 1 Unlock

Question Has Been Solved by an Expert!
Get step-by-step solutions from verified subject matter experts
Step: 2 Unlock
Step: 3 Unlock