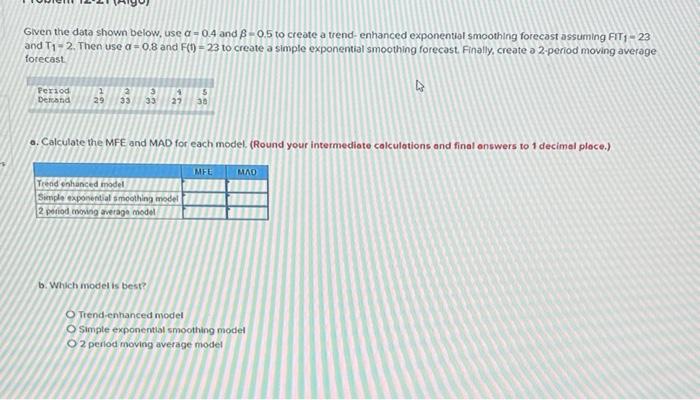
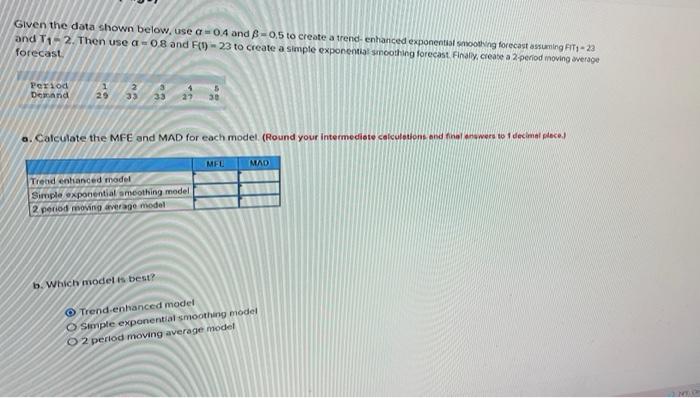
Question: Given the data shown below, use a -0.4 and 8 -05 to create a tend-enhanced exponential smoothing forecast assuming FIT - 23 and T1 -

Given the data shown below, use a -0.4 and 8 -05
Given the data shown below, use a -0.4 and 8 -05 to create a tend-enhanced exponential smoothing forecast assuming FIT - 23 and T1 - 2. Then use a=0.8 and F(t) = 23 to create a simple exponential smoothing forecast. Finally, create a 2 period moving average forecast V Period Demand 29 33 3 33 27 38 a. Calculate the MFE and MAD for each model. (Round your intermediate calculations and final answers to 1 decimal place.) MEL Trand enhanced model Sienple exponential smoothing model 2 period moving average model b. Which model is best? Trend-enhanced model O Simple exponential smoothing model O 2 period moving average model Given the series of demand data below 9 31 10 32 1 20 1 22 35 Podi Dehndi 23 24 23 30 34 Bicture Click here for the Excel Data File a. Calculate the forecasts for periods 7 through 11 using moving average models with 2.-4, and 6. Round your intermediate calculations and final answers to 1 decimal place.) 4 -6 -2 Wek 7 9 9 10 11 6-1. Calculate the bias and MAD for each set of forecasts. (Negative answers should be indicated by a minus sign. Round your Intermediate calculations and final answers to 1 decimal place.) Moving Average Forecast - 4 n5 Bias MAD b-2. Which moving average model is best with respect to MAD? O 6-week moving average O 2-week moving average O 4-week moving average 7 of 8

Step by Step Solution

There are 3 Steps involved in it

1 Expert Approved Answer
Step: 1 Unlock blur-text-image
Question Has Been Solved by an Expert!

Get step-by-step solutions from verified subject matter experts

Step: 2 Unlock
Step: 3 Unlock

Students Have Also Explored These Related General Management Questions!