

Question: Given the data tables below; a) Compare the values measured using the Vickers and Rockwell hardness test results. You can find a conversion chart on
Given the data tables below;
a) Compare the values measured using the Vickers and Rockwell hardness test results. You can find a conversion chart on the Internet (type in Hardness Conversion Chart into Google).
b) Convert the hardness measurements from the Vickers Hardness tester to the tensile strength in MPa and compare the results to the ?uts from the first part of this lab. You can find a conversion chart on the Internet (type in Hardness Conversion Chart into Google).
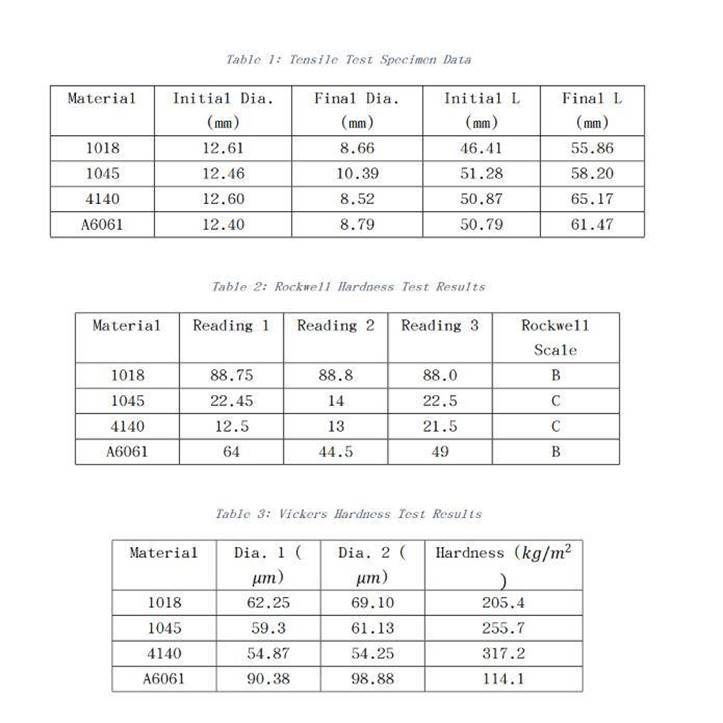
Table 1: Tensile Test Specimen Data Material Initial Dia. Final Dia. Initial L Final L (mm) (mm) (mm) (mm) 1018 12.61 8.66 46.41 55.86 1045 12.46 10.39 51.28 58.20 4140 12.60 8.52 50.87 65.17 A6061 12.40 8.79 50.79 61.47 Table 2: Rockwell Hardness Test Results Material Reading 1 Reading 2 Reading 3 Rockwell Scale 1018 88.75 88.8 88.0 B 1045 22.45 14 22.5 C 4140 12.5 13 21.5 C A6061 64 44.5 49 B Table 3: Vickers Hardness Test Results Material Dia. 1 ( Dia. 2 ( Hardness (kg/m ) m) ) 1018 62.25 69.10 205.4 1045 59.3 61.13 255.7 4140 54.87 54.25 317.2 A6061 90.38 98.88 114.1
Step by Step Solution
There are 3 Steps involved in it

Get step-by-step solutions from verified subject matter experts