

Question: . Given the following ANOVA output, answer the questions that follow: Source DF SS MS F Treatment 3 51.87 17.29 Block 4 14.71 3.68 1.21
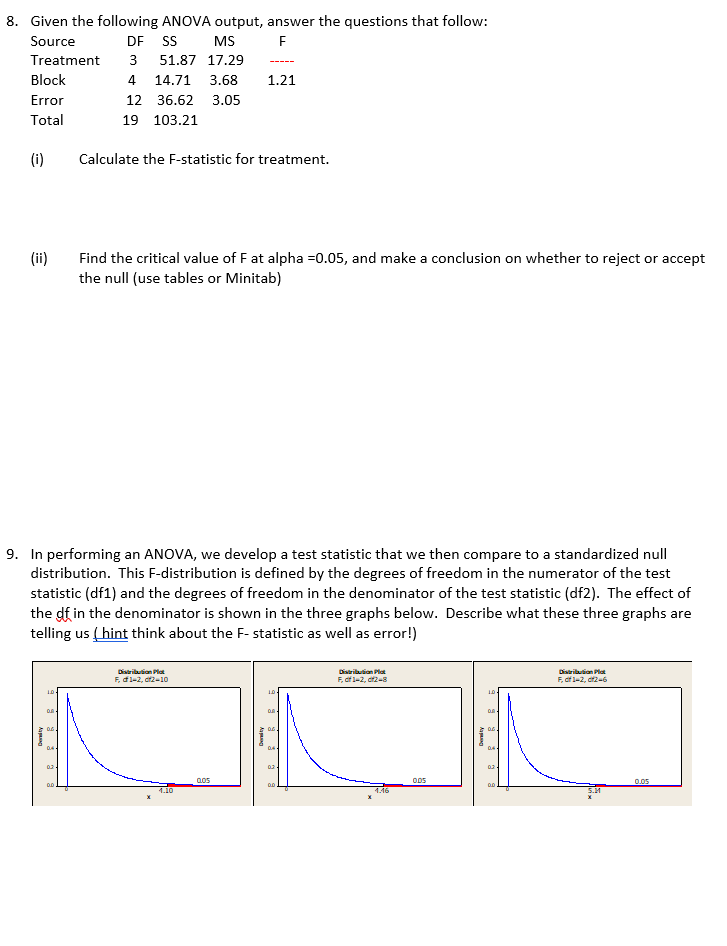

. Given the following ANOVA output, answer the questions that follow: Source DF SS MS F Treatment 3 51.87 17.29 Block 4 14.71 3.68 1.21 Error 12 36.62 3.05 Total 19 103.21 (i) Calculate the F-statistic for treatment. (ii) Find the critical value of Fat alpha =0.05, and make a conclusion on whether to reject or accept the null (use tables or Minitab) 9. In performing an ANOVA, we develop a test statistic that we then compare to a standardized null distribution. This F-distribution is defined by the degrees of freedom in the numerator of the test statistic (df1) and the degrees of freedom in the denominator of the test statistic (df2). The effect of the of in the denominator is shown in the three graphs below. Describe what these three graphs are telling us ( hint think about the F- statistic as well as error!) Distribution Ples Distribution Plet F. of1-2, 012-10 F. of 1-2, diz-8 F, diff 1-2, di2-6 BE RE 0.05 1.10 1.46 S.M10. In a randomized block experimental design, it was found that there was very little variation within and between blacks. Knowing that the net effect of including blocks in a study is that it reallocates degrees of freedom from the variance within groups Ill- the "noise"] to the blocking variablelfactor, what impact does blocking have on this study? Include whether situations like this would, generally, lead to an increase in type | or type II error
Step by Step Solution
There are 3 Steps involved in it

Get step-by-step solutions from verified subject matter experts