

Question: Given the following box plot: 0 3 5 12 13 (a) Which quarter has the smallest spread of data? What is that spread? The ClickforList
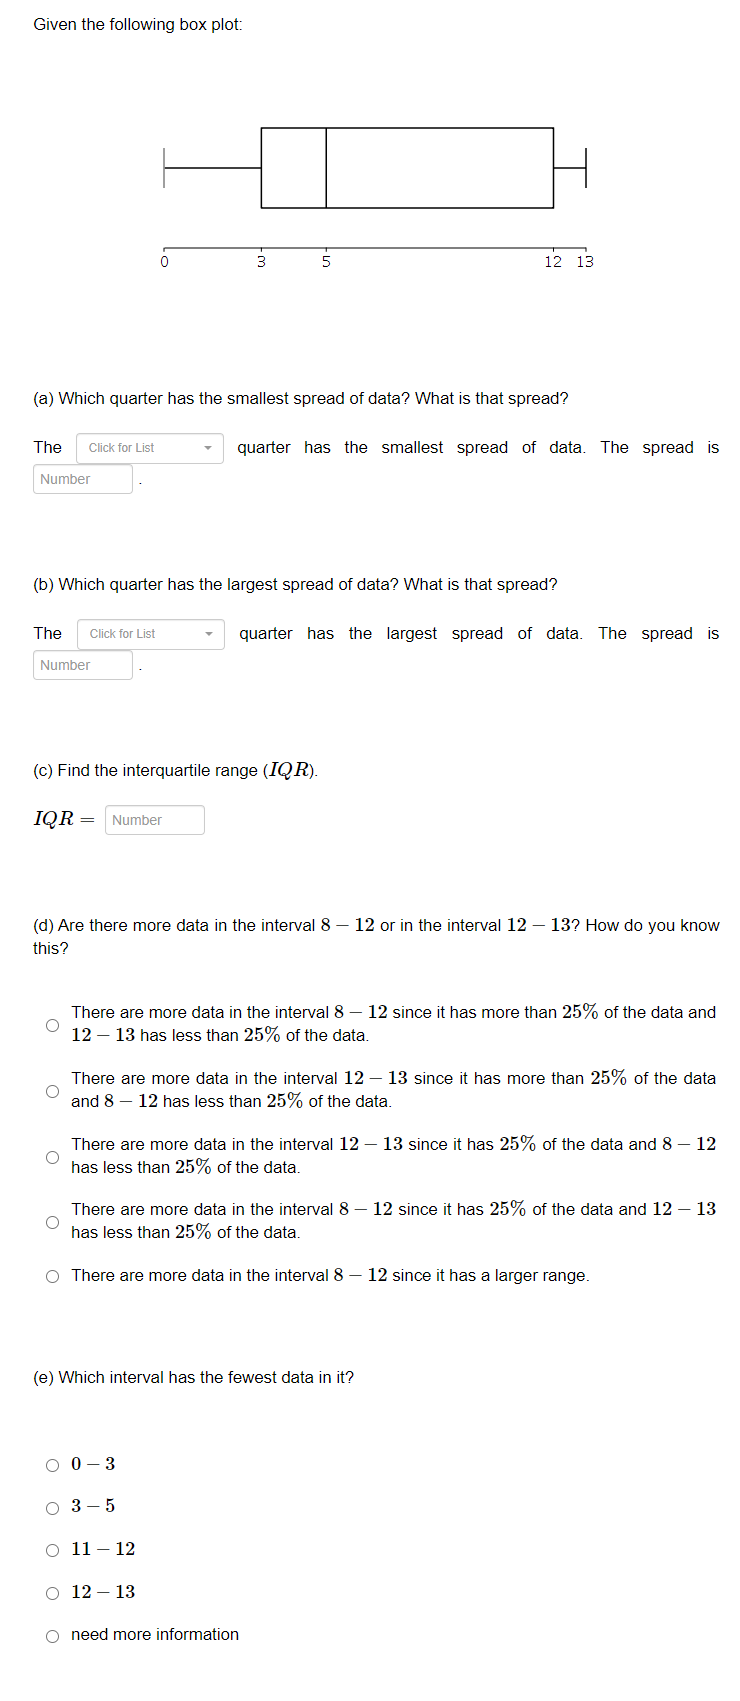
Given the following box plot: 0 3 5 12 13 (a) Which quarter has the smallest spread of data? What is that spread? The ClickforList - quarter has the smallest spread of data. The spread is Number ([1) Which quarter has the largest spread of data? What is that spread? The ClickforList - quarter has the largest spread of data. The spread is Number (0) Find the interquartile range {IQR}. IQR = Number (d) Are there more data in the interval 8 12 or in the interval 12 13'? How do you know this? 0 There are more data in the interval 8 1 12 since it has more than 25% of the data and 12 13 has less than 25% of the data. There are more data in the interval 12 1 13 since it has more than 25% of the data 0 and 8 12 has less than 25% of the data. 0 There are more data in the interval 12 13 since it has 25% of the data and 8 12 has less than 25% of the data. 0 There are more data in the interval 8 12 since it has 25% of the data and 12 13 has less than 25% of the data. C) There are more data in the interval 8 12 Since it has a larger range. (e) Which interval has the fewest data in it? C) 03 0 35 0 1112 C) 1213 0 need more information
Step by Step Solution
There are 3 Steps involved in it

Get step-by-step solutions from verified subject matter experts