

Question: Choose the correct answer below: A. Instability B. Trend C. Level shift D. Cycle Given the following control chart, which problem is most likely? X-Bar
Choose the correct answer below:
A. Instability
B. Trend
C. Level shift
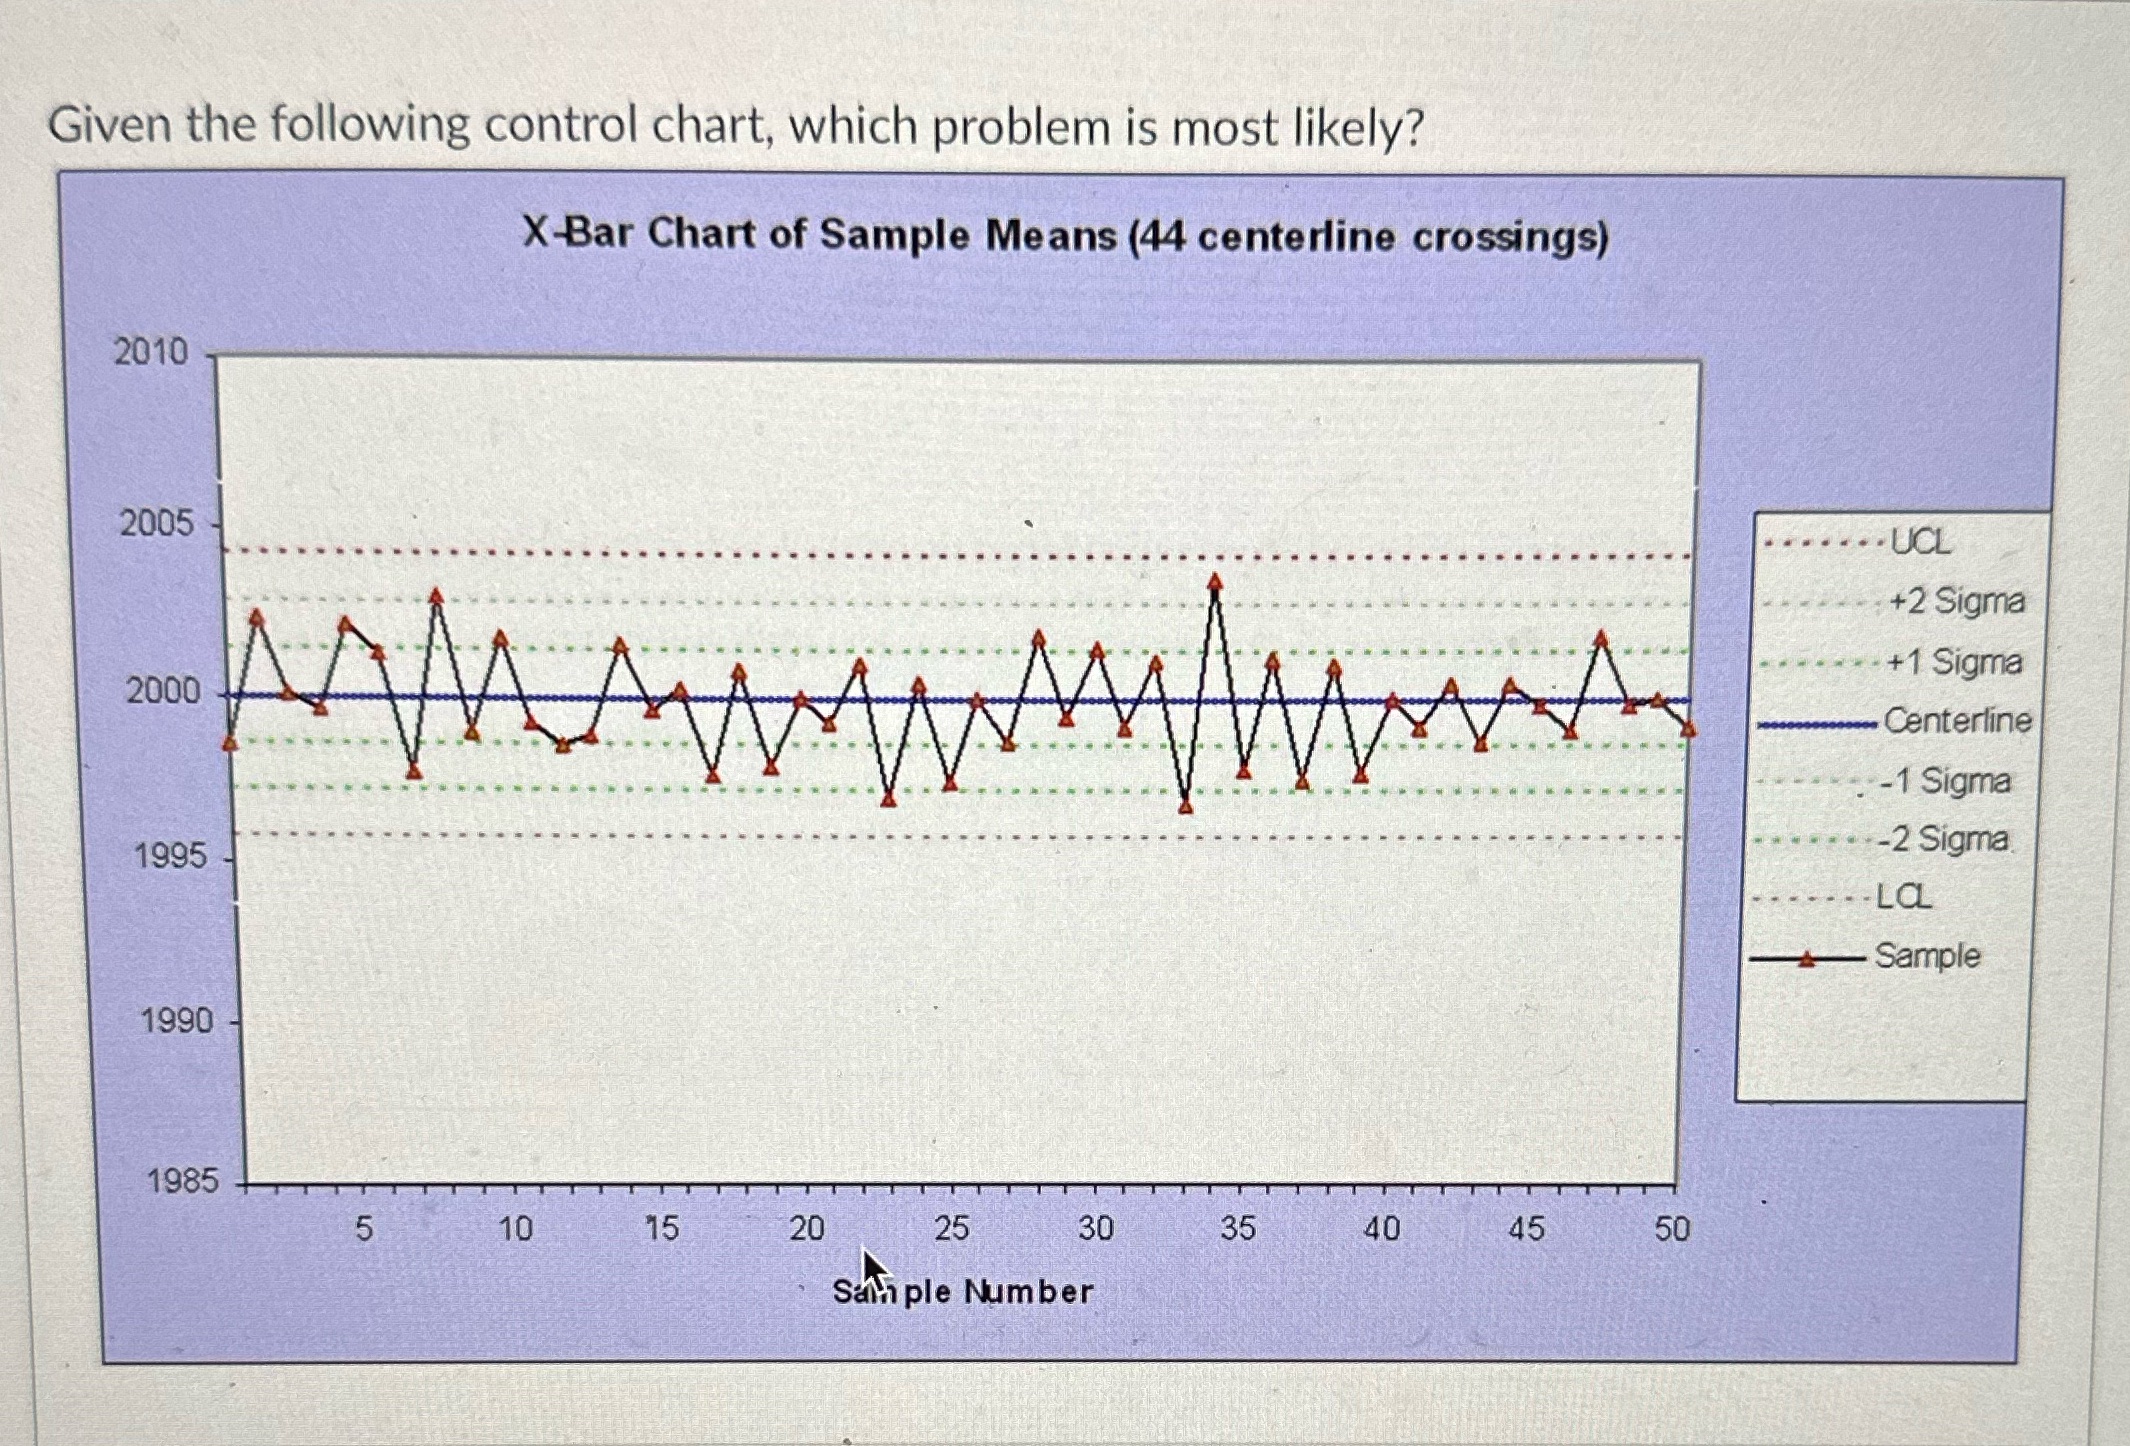
D. Cycle
Given the following control chart, which problem is most likely? X-Bar Chart of Sample Means (44 centerline crossings) 2010 2005 2000 1995 .....UCL +2 Sigma M +1 Sigma . Centerline -1 Sigma wwwwwwwwww -2 Sigma 1990 1985 5 10 10 15 20 20 25 30 Sample Number 35 40 40 45 55 50 50 La Sample
Step by Step Solution
3.35 Rating (158 Votes )
There are 3 Steps involved in it
Control charts are used in statistical process control to monitor whether a process is in a state of ... View full answer

Get step-by-step solutions from verified subject matter experts