

Question: Given the following data for the five activities (A to E) in this project over 9 weeks. Answer the following questions: Q.3.6 Plot (graphically illustrate)
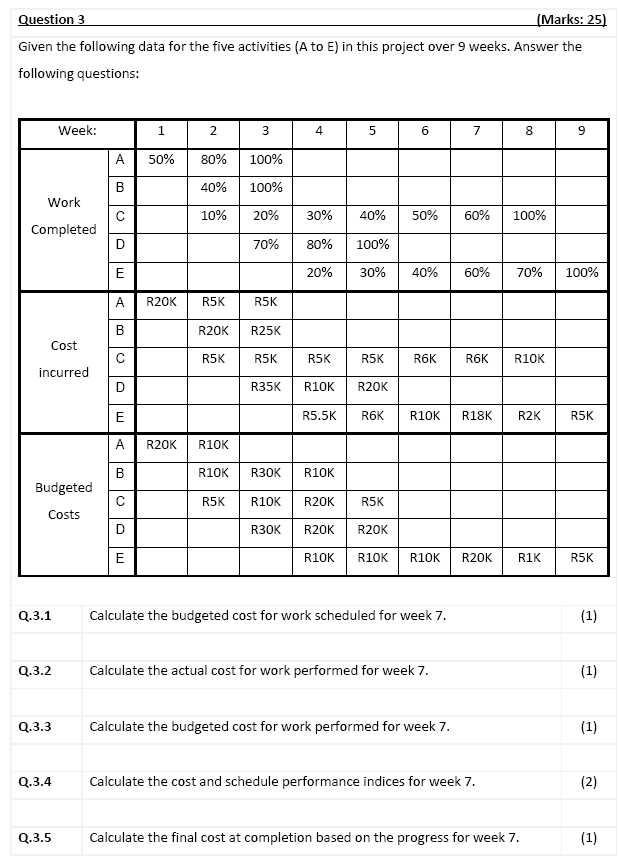
Given the following data for the five activities (A to E) in this project over 9 weeks. Answer the following questions: Q.3.6 Plot (graphically illustrate) the cost/schedule performance for week 1 to 9 and comment on the project's performance changes during those periods (Ensure to indicate the values for each week). Given the following data for the five activities (A to E) in this project over 9 weeks. Answer the following questions: Q.3.6 Plot (graphically illustrate) the cost/schedule performance for week 1 to 9 and comment on the project's performance changes during those periods (Ensure to indicate the values for each week)
Step by Step Solution
There are 3 Steps involved in it
1 Expert Approved Answer
Step: 1 Unlock

Question Has Been Solved by an Expert!
Get step-by-step solutions from verified subject matter experts
Step: 2 Unlock
Step: 3 Unlock