

Question: Given the following data in the chart . ,please provide explanations, to each question highlighted in yellowed. 1) Did the total number of deliveries increase
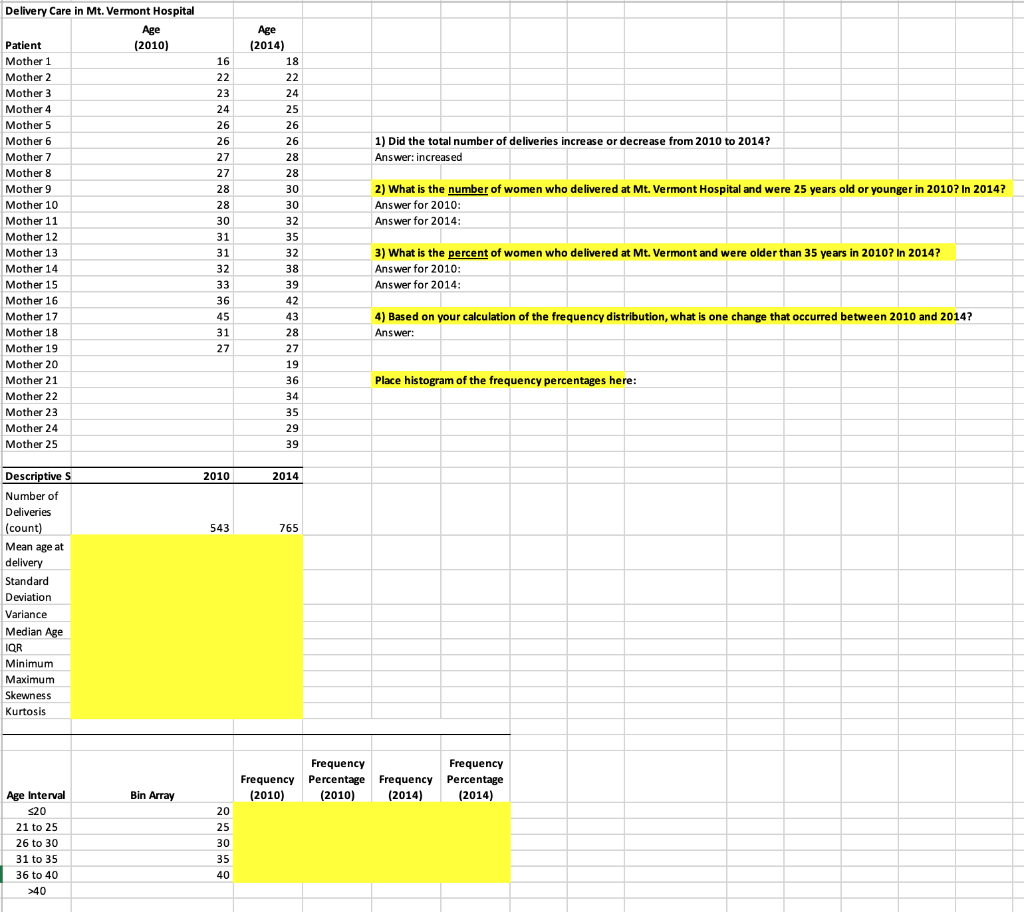 Given the following data in the chart . ,please provide explanations, to each question highlighted in yellowed.
Step by Step Solution
There are 3 Steps involved in it
1 Expert Approved Answer
Step: 1 Unlock

Question Has Been Solved by an Expert!
Get step-by-step solutions from verified subject matter experts
Step: 2 Unlock
Step: 3 Unlock