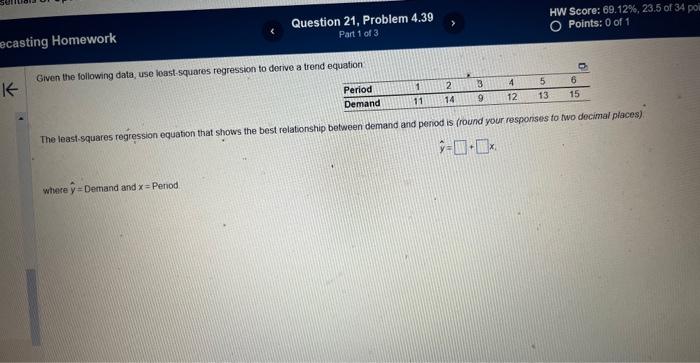
Question: Given the following data; use loast-squares regression to derive a trend equatian The least-squares regression equation that shows the best relationship between demand and period

Given the following data; use loast-squares
Given the following data; use loast-squares regression to derive a trend equatian The least-squares regression equation that shows the best relationship between demand and period is (round your responses fo two decimal piaces). y^=+x1 whise y^= Demand and x= Penod Given the following data; use loast-squares regression to derive a trend equatian The least-squares regression equation that shows the best relationship between demand and period is (round your responses fo two decimal piaces). y^=+x1 whise y^= Demand and x= Penod

Step by Step Solution

There are 3 Steps involved in it

1 Expert Approved Answer
Step: 1 Unlock blur-text-image
Question Has Been Solved by an Expert!

Get step-by-step solutions from verified subject matter experts

Step: 2 Unlock
Step: 3 Unlock

Students Have Also Explored These Related General Management Questions!