

Question: Given the following data, Year t 1 2 3 4 5 6 7 8 9 10 11 12 1 2 3 Quarter 1 2
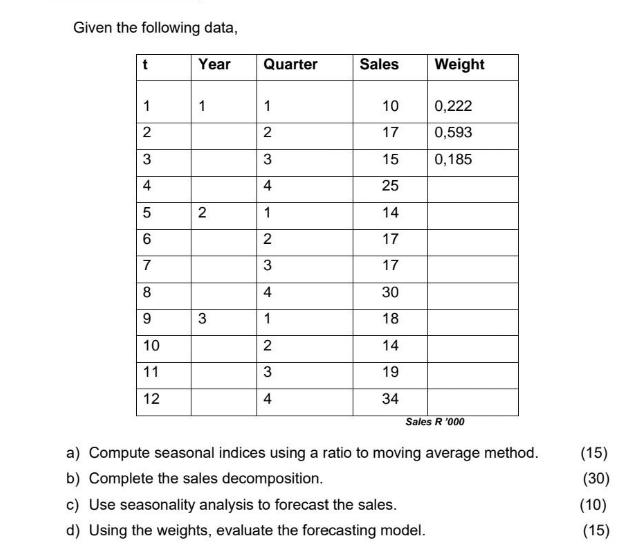
Given the following data, Year t 1 2 3 4 5 6 7 8 9 10 11 12 1 2 3 Quarter 1 2 3 4 1 2 3 4 1 2 3 4 Sales 10 17 15 25 14 17 17 30 18 14 19 34 Weight 0,222 0,593 0,185 Sales R '000 a) Compute seasonal indices using a ratio to moving average method. b) Complete the sales decomposition. c) Use seasonality analysis to forecast the sales. d) Using the weights, evaluate the forecasting model. (15) (30) (10) (15)
Step by Step Solution
There are 3 Steps involved in it
SOLUTION To compute seasonal indices using the ratio to moving average method we need to follow these steps a Compute seasonal indices using the ratio to moving average method Calculate the moving ave... View full answer

Get step-by-step solutions from verified subject matter experts