

Question: Given the following information Expected demand during a lead time = 350 units Standard deviation of demand during a lead time = 32 units Demand
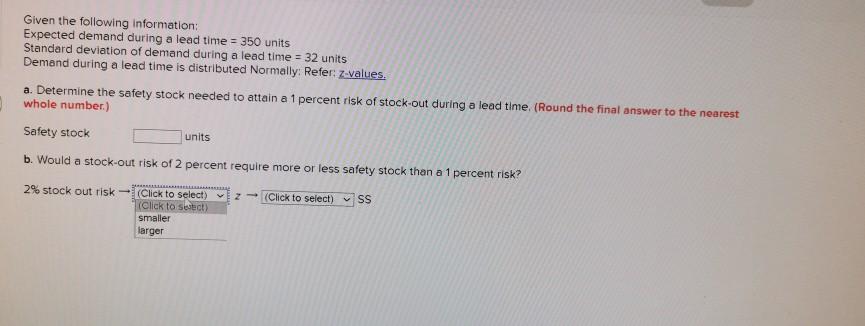
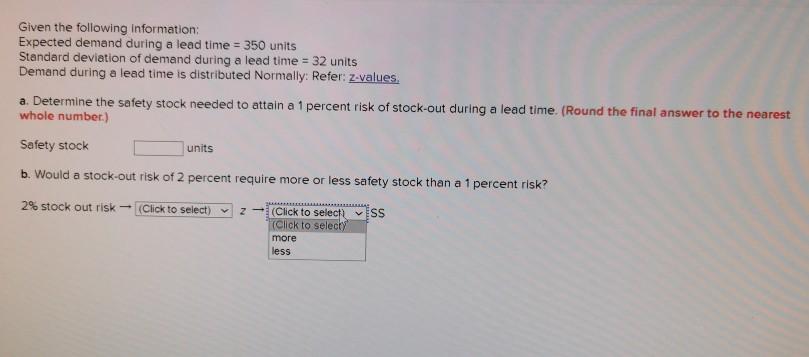
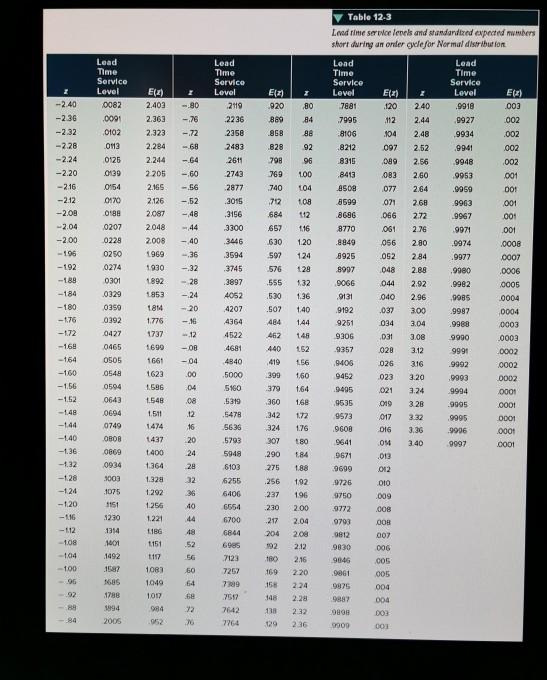
Given the following information Expected demand during a lead time = 350 units Standard deviation of demand during a lead time = 32 units Demand during a lead time is distributed Normally: Refer: Z-values. a. Determine the safety stock needed to attain a 1 percent risk of stock-out during a lead time (Round the final answer to the nearest whole number.) Safety stock units b. Would a stock-out risk of 2 percent require more or less safety stock than a 1 percent risk? 2% stock out risk SS (Click to select) Z (Click to select) (Click to select smaller larger Given the following information: Expected demand during a lead time = 350 units Standard deviation of demand during a lead time = 32 units Demand during a lead time is distributed Normally: Refer: Z-values. a. Determine the safety stock needed to attain a 1 percent risk of stock-out during a lead time. (Round the final answer to the nearest whole number) Safety stock units b. Would a stock-out risk of 2 percent require more or less safety stock than a 1 percent risk? 2% stock out risk - (Click to select) LLLLLS z (Click to select) VSS (Click to select more less Time 2 E) 2.403 2.363 80 Lead Time Service Level 0082 .0091 0102 ON3 0126 0139 -2.40 -2.36 -2.32 -2.26 84 2.323 88 2.284 -2.24 -2.20 2.244 2205 2.165 001 -216 -2.12 -2.08 -2.04 -2.00 -196 -192 -189 -184 -80 -76 -72 -68 -64 - 60 - 56 -52 -48 - 44 -40 -36 -32 - 28 -24 -20 -16 2.126 2.087 2048 2008 1969 1930 1892 272 Lead Time Service Level 249 2236 2358 2483 2611 2743 2877 3015 3156 3300 3446 3594 .3745 3897 4052 4207 4364 4522 4681 4840 9985 -180 -176 -172 ) 920 889 .868 .B28 798 769 740 712 684 .657 630 592 576 .555 .530 -507 484 462 440 419 399 379 360 .342 324 307 290 275 256 237 .230 ,217 204 192 0154 0170 0188 0207 0228 0250 0274 0301 0329 0350 0392 0427 0465 0505 0548 0504 0643 0694 0749 OBOB 0809 0934 9003 1075 1151 5230 1314 1001 92 96 100 104 108 112 116 1.20 124 128 1.32 1.36 1.40 144 148 152 156 1,60 164 1.68 172 1.76 180 184 1.88 1.92 196 -168 Table 12.3 Lood rime serie leels and standardized expected members short during an order guide for Normal distribution Load Lead Time Service Service Level E(2) Level E() 7881 120 240 .9910 .003 7995 112 2.44 9927 002 8106 104 2.48 9934 .002 .8212 097 2.52 9941 002 8315 089 2.56 9948 002 8413 083 2.60 9953 8508 077 2.64 .9959 001 8599 071 268 9963 001 8696 066 9967 001 8770 061 2.76 9971 001 .8849 056 2.00 9974 .0008 8925 052 284 .9977 0007 8997 048 2.88 .9980 .0006 9066 044 2.92 .9982 0005 9131 040 2.96 0004 9192 037 3.00 9987 0004 9251 034 3.04 9988 0003 9306 031 3.08 9990 0003 9357 028 3.12 9991 0002 9406 026 3.16 .9992 .0002 9452 023 3.20 9993 0002 9495 021 3.24 9994 0001 .9535 019 3.28 -9995 0001 9573 017 3.32 9995 0001 .9608 DIG 3.36 9996 0001 9641 OM 3.40 9997 0001 9671 9699 012 9726 010 9750 2009 .9772 .008 0793 008 0812 007 9830 9046 .005 9861 005 9875 004 9882 004 9898 DO3 9900 003 -08 - 164 -160 1953 1814 1.776 1737 1699 1661 1623 1.596 1.548 1.511 1474 1437 1400 1.364 1.328 -04 .00 5000 -1.56 -1.52 -1.48 -144 -1.40 -1.36 - 1.32 04 .08 12 16 20 24 28 32 36 .5160 .5319 .5478 5636 5793 5948 6103 013 40 -128 -124 - 1.20 - 116 -112 -1.08 -104 -100 1292 1.256 1.221 1186 1151 1117 44 48 52 5G 2.00 2.04 2.08 2.12 2.16 006 6255 6406 6554 6700 6844 6985 7123 7257 7200 7517 7642 7964 1063 1.049 169 1492 .1582 1685 1788 1994 2005 .96 92 614 2.20 2.24 1017 984 952 . 72 . 148 138 229 2:32 236
Step by Step Solution
There are 3 Steps involved in it
1 Expert Approved Answer
Step: 1 Unlock

Question Has Been Solved by an Expert!
Get step-by-step solutions from verified subject matter experts
Step: 2 Unlock
Step: 3 Unlock