

Question: Given the following output from Excel, identify the standard deviation for Overall GPA (rounded to the nearest hundredth). Overall GPA Test Scores Mean 3.076 Mean
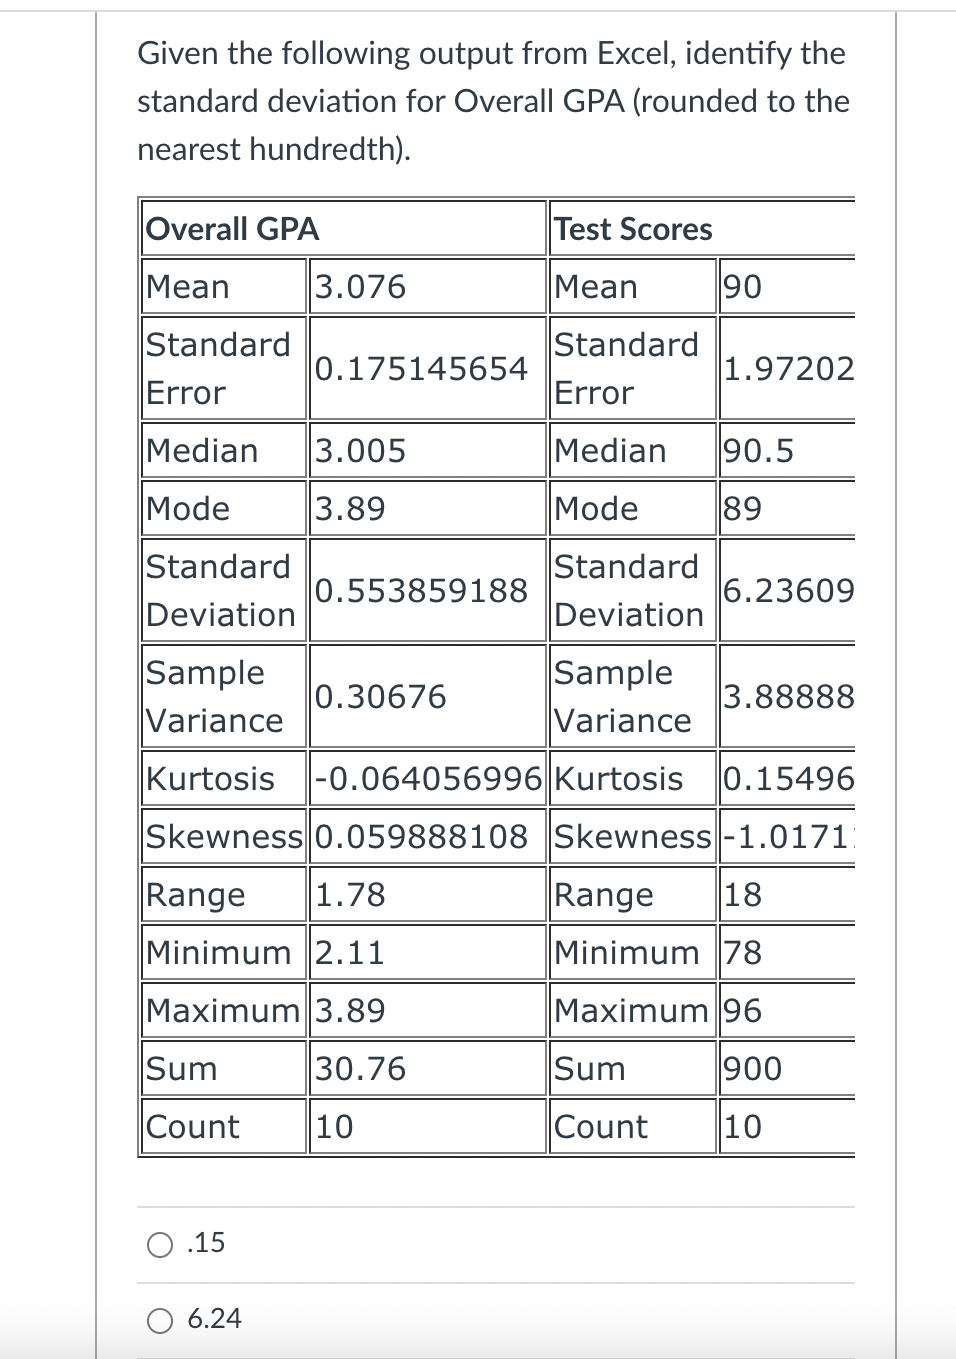
Given the following output from Excel, identify the standard deviation for Overall GPA (rounded to the nearest hundredth). Overall GPA Test Scores Mean 3.076 Mean 90 Standard Standard 0.175145654 1.97202 Error Error Median 3.005 Median 90.5 Mode 3.89 Mode 89 Standard Standard 0.553859188 6.23609 Deviation Deviation Sample Sample 0.30676 3.88888 Variance Variance Kurtosis -0.064056996 Kurtosis 0. 15496 Skewness 0.059888108 Skewness -1.0171: Range 1.78 Range 18 Minimum 2.11 Minimum 78 Maximum 3.89 Maximum 96 Sum 30.76 Sum 900 Count 10 Count 10 O .15 O 6.24
Step by Step Solution
There are 3 Steps involved in it
1 Expert Approved Answer
Step: 1 Unlock

Question Has Been Solved by an Expert!
Get step-by-step solutions from verified subject matter experts
Step: 2 Unlock
Step: 3 Unlock