

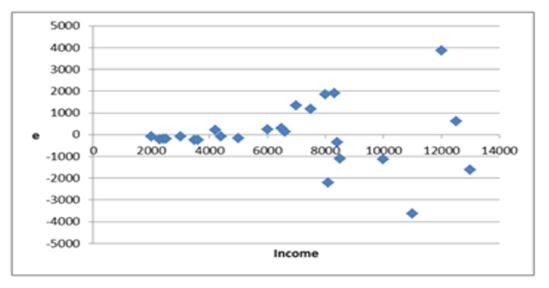
Question: Given the following residual plot, we can see that the dots are much more spread out on the right side of the graph than they
Given the following residual plot, we can see that the dots are much more spread out on the right side of the graph than they are on the left side of the graph. What can be concluded about the estimated regression equation?
\f
Step by Step Solution
There are 3 Steps involved in it
1 Expert Approved Answer
Step: 1 Unlock

Question Has Been Solved by an Expert!
Get step-by-step solutions from verified subject matter experts
Step: 2 Unlock
Step: 3 Unlock