

Question: Given the following two regression output summary tables, determine which model provides a better fit. a) Model 1 is the better model because the R
Given the following two regression output summary tables, determine which model provides a better fit.
a)
Model 1 is the better model because the R2of 0.0003 (in Model 1) is more statistically significant than the R2of 0.6971 (in Model 2).
b)
Model 1 is the better model because the Adjusted R2of 0.0009 (in Model 1) is more statistically significant than the Adjusted R2of 0.6967 (in Model 2).
c)
Model 2 is the better model because the R2of 0.0003 (in Model 1) is smaller than the R2of 0.6971 (in Model 2).
d)
Model 2 is the better model because the Adjusted R2of 0.0009 (in Model 1) is smaller than the Adjusted R2of 0.6967 (in Model 2).
This regression equation attempts to predict the Price of a house using Age and Square Feet.
Which of the following is true?
Question 24 options:
a)
Because the significance F of 9.4E-24 is not less than 0.05, we can NOT conclude that at least one of our predictor variables was significant.
b)
The Sq. Ft. coefficient means that each additional square foot decreases the price of a home by $147.48, on average and holding Age constant.
c)
The Age coefficient of 1378.20 means that as a house gets older by 1 year, the price decreases by $1378.20, on average and holding Sq. Ft. constant.
d)
R2= 0.67 means that 67% of variation in price of a house is accounted for using Age and Sq. Ft. of the house.
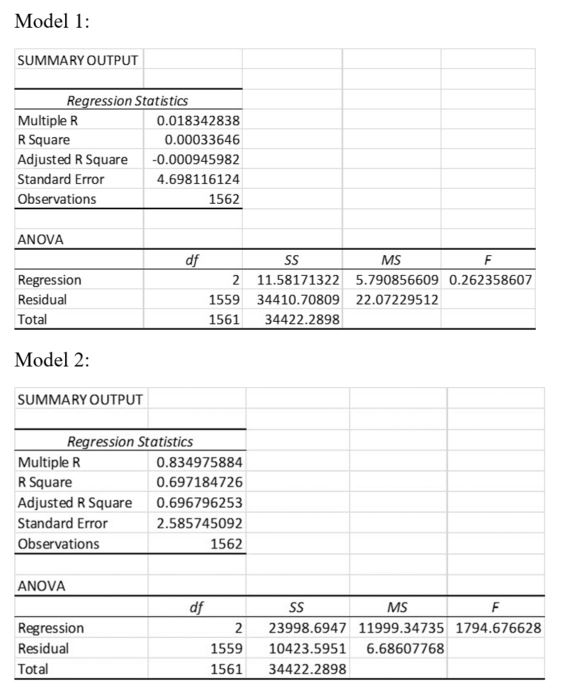
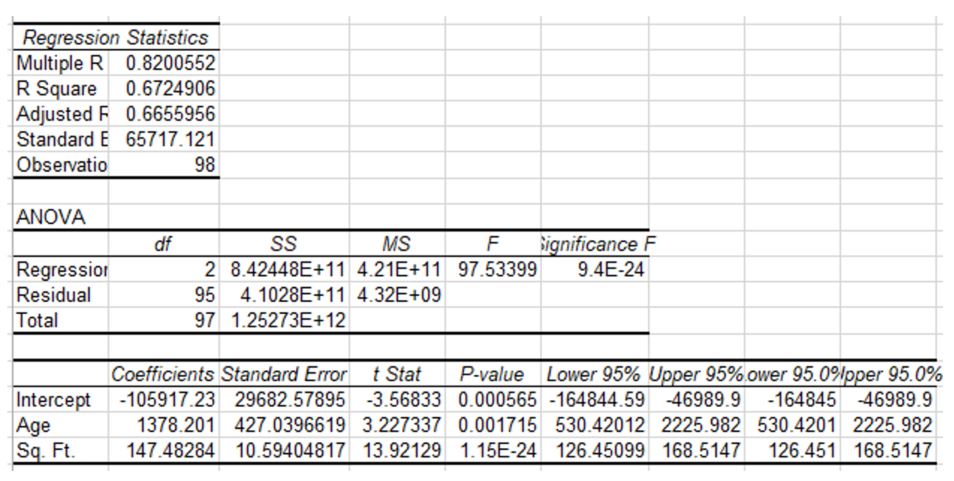
Model 1: SUMMARY OUTPUT Regression Statistics Multiple R 0.018342838 R Square 0.00033646 Adjusted R Square -0.000945982 Standard Error 4.698116124 Observations 1562 ANOVA df SS MS F Regression 2 11.58171322 5.790856609 0.262358607 Residual 1559 34410.70809 22.07229512 Total 1561 34422.2898 Model 2: SUMMARY OUTPUT Regression Statistics Multiple R 0.834975884 R Square 0.697184726 Adjusted R Square 0.696796253 Standard Error 2.585745092 Observations 1562 ANOVA of SS MS F Regression 2 23998.6947 11999.34735 1794.676628 Residual 1559 10423.5951 6.68607768 Total 1561 34422.2898Regression Statistics Multiple R 0.8200552 R Square 0.6724906 Adjusted F 0.6655956 Standard E 65717.121 Observatio 98 ANOVA df SS MS F significance F Regression 2 8.42448E+11 4.21E+11 97.53399 9.4E-24 Residual 95 4. 1028E+11 4.32E+09 Total 97 1.25273E+12 Coefficients Standard Error t Stat P-value Lower 95% Upper 95% ower 95.09/pper 95.0% Intercept -105917.23 29682.57895 -3.56833 0.000565 -164844.59 -46989.9 -164845 -46989.9 Age 1378.201 427.0396619 3.227337 0.001715 530.42012 2225.982 530.4201 2225.982 Sq. Ft. 147.48284 10.59404817 13.92129 1.15E-24 126.45099 168.5147 126.451 168.5147
Step by Step Solution
There are 3 Steps involved in it

Get step-by-step solutions from verified subject matter experts