

Question: Given the following two residual plot figures (a) and (b), please respectively explain what problems exist in the left parts of figures (a) and (b),
Given the following two residual plot figures (a) and (b), please respectively explain what problems exist in the left parts of figures (a) and (b), and provide the solutions to them, transforming the left parts of figure (a) and (b) to the right parts of the figures (a) and (b).
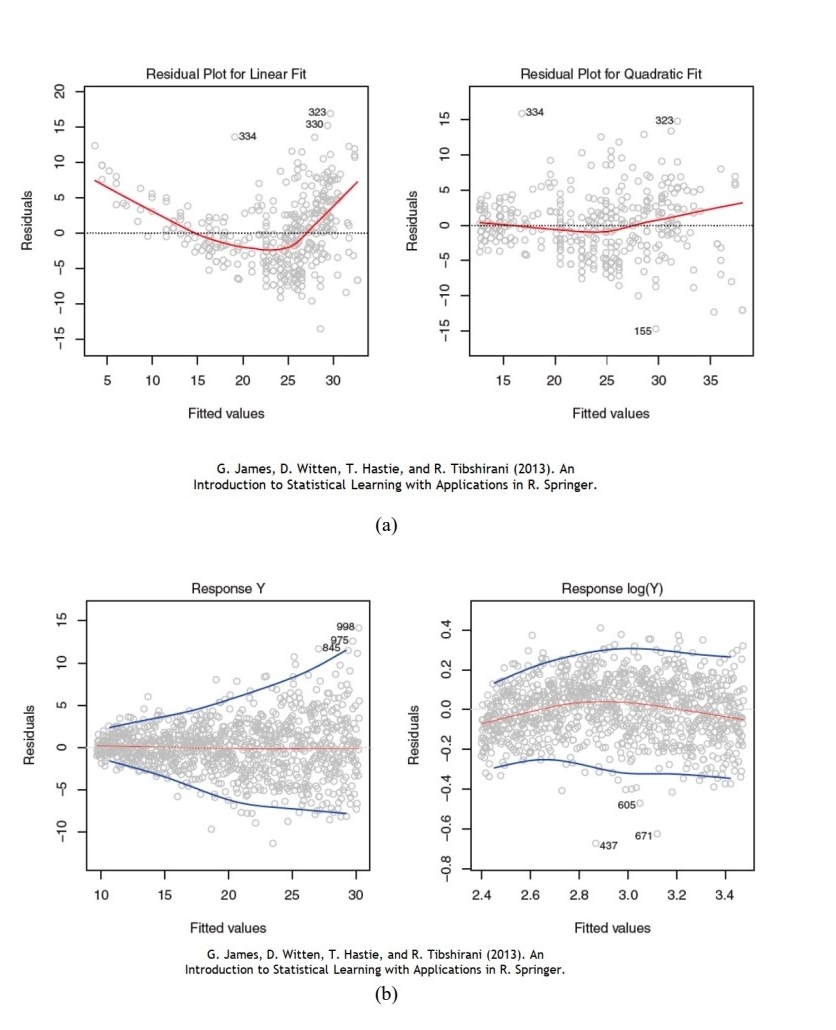
Residual Plot for Linear Fit Residual Plot for Quadratic Fit 20 323 334 330 323 15 334 10 10 CRO O 8 O LO 5 PO CO Residuals Residuals 0 0 o ogg BOX O O -15 -10 -5 -15 -10 -5 1550 10 15 20 25 30 15 20 25 30 35 Fitted values Fitted values G. James, D. Witten, T. Hastie, and R. Tibshirani (2013). An Introduction to Statistical Learning with Applications in R. Springer. (a) Response Y Response log(Y) 998 O 84 50 LO Residuals Residuals O -0.8 -0.6 -0.4 -0.2 0.0 0.2 0.4 LO 6050 -10 6710 0437 10 15 20 25 30 2.4 2.6 2.8 3.0 3.2 3.4 Fitted values Fitted values G. James, D. Witten, T. Hastie, and R. Tibshirani (2013). An Introduction to Statistical Learning with Applications in R. Springer. (b)
Step by Step Solution
There are 3 Steps involved in it

Get step-by-step solutions from verified subject matter experts