

Question: Given the following Year 12 balance sheet data for a footwear company: Balance Sheet Data Cash on Hand Total Current Assets Total Fixed Assets Total
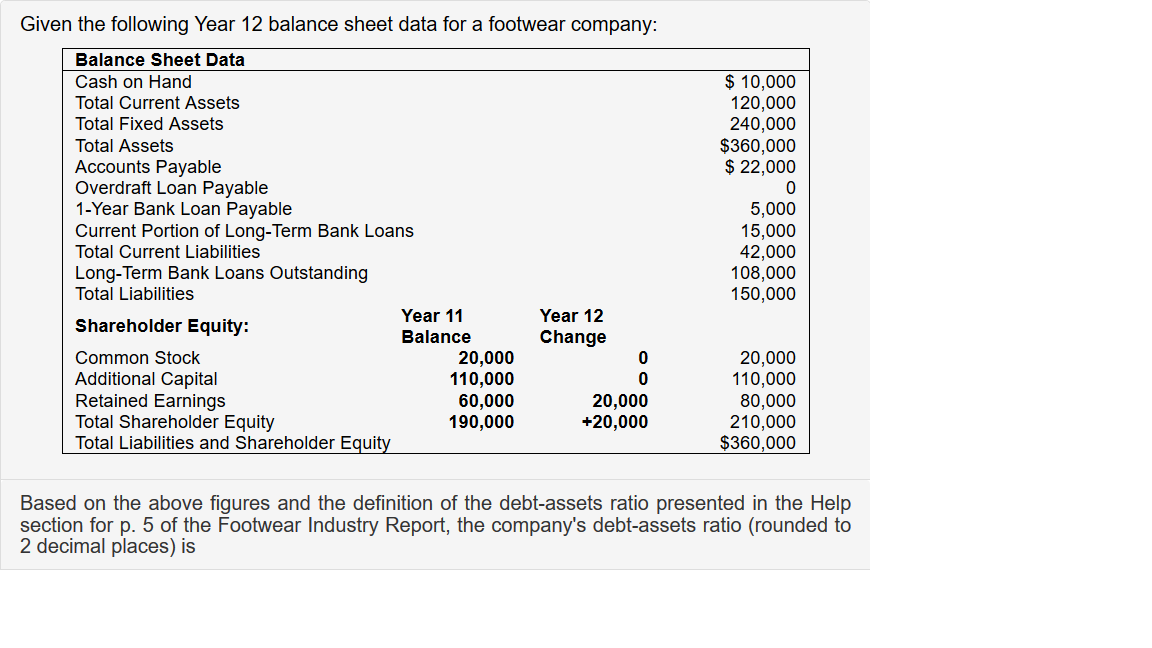
Given the following Year 12 balance sheet data for a footwear company: Balance Sheet Data Cash on Hand Total Current Assets Total Fixed Assets Total Assets Accounts Payable Overdraft Loan Payable 1-Year Bank Loan Payable Current Portion of Long-Term Bank Loans Total Current Liabilities Long-Term Bank Loans Outstanding Total Liabilities Year 11 Shareholder Equity: Balance Common Stock 20,000 Additional Capital 110,000 Retained Earnings 60,000 Total Shareholder Equity 190,000 Total Liabilities and Shareholder Equity $ 10,000 120,000 240,000 $360,000 $ 22,000 0 5,000 15,000 42,000 108,000 150,000 Year 12 Change 0 0 20,000 +20,000 20,000 110,000 80,000 210,000 $360,000 Based on the above figures and the definition of the debt-assets ratio presented in the Help section for p. 5 of the Footwear Industry Report, the company's debt-assets ratio (rounded to 2 decimal places) is
Step by Step Solution
There are 3 Steps involved in it

Get step-by-step solutions from verified subject matter experts