

Question: Given: The graph below 6 -5 1. State: O domain and range O x and y intercepts if applicable O max and min if applicable
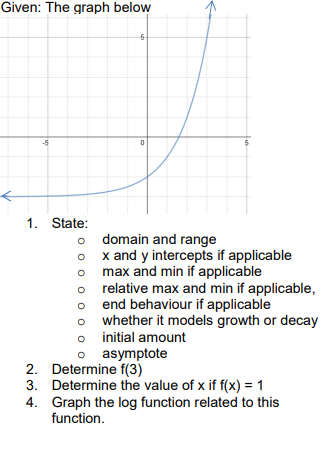
Given: The graph below 6 -5 1. State: O domain and range O x and y intercepts if applicable O max and min if applicable O relative max and min if applicable, O end behaviour if applicable O whether it models growth or decay O initial amount o asymptote 2. Determine f(3) 3. Determine the value of x if f(x) = 1 4. Graph the log function related to this function
Step by Step Solution
There are 3 Steps involved in it
1 Expert Approved Answer
Step: 1 Unlock

Question Has Been Solved by an Expert!
Get step-by-step solutions from verified subject matter experts
Step: 2 Unlock
Step: 3 Unlock