

Question: Given the graph (in blue) of a function f(x), plot the graph (in red) of the function 2. f(-x) by moving the red points
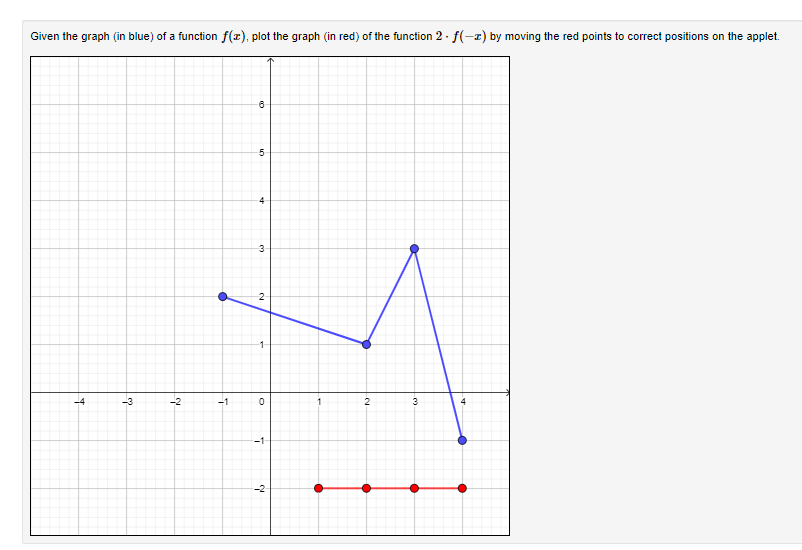
Given the graph (in blue) of a function f(x), plot the graph (in red) of the function 2. f(-x) by moving the red points to correct positions on the applet. -4 -3 -2 T 6 5 -4 3 2 -1- 0 -1 -2 1 2 3 4
Step by Step Solution
There are 3 Steps involved in it
1 Expert Approved Answer
Step: 1 Unlock

Question Has Been Solved by an Expert!
Get step-by-step solutions from verified subject matter experts
Step: 2 Unlock
Step: 3 Unlock