Question: Given the graph of f (@), when does f () = 2? 3 1-2 1 2 O ate = 3 O at a = 2

 Given the graph of f (@), when does f () =2? 3 1-2 1 2 O ate = 3 O at a= 2 Of(x) never equals 2 O atx = -2N -4 -3> X The figure above shows the graph of function f. Whatis the range of function f? 0 -5 > - 1 inthe y-axis, its equation would be Oy c+1 O y= - c-1 Oy=-2x-1 Outx-1The function y = g() is shown in Diagram 1.The equation of the function shown in Diagram 2 could be y+ H Diagram 1 Diagram 2 1 O y= 9() O y=-9(-#) Oy= -g(x) O y = g(-#)If the graph of the equationy = a 3 were expanded vertically by a factor of 4and reflected in the I-axie. the new equation weuld be: D y=4:e+32L": y=%m+2 '3' y=-4E+B D y=4m32 The graph of y = f()is transformed by a horizontal expansion by a factor of 4 anda vertical expansion by a factor of 5. The equation of thisnew image has the form y = af(bx) ; find a andb. O a = 5, b = _ O a = 5,b= 4 O a = =, b = O a= -,b=4How isthe graph of y = (@ - 2) - 4 related tothe graph of y = ( Cimage text in transcribedimage text in transcribedimage text in transcribedimage text in transcribed

image text in transcribedimage text in transcribedimage text in transcribedimage text in transcribedimage text in transcribedimage text in transcribedimage text in transcribedimage text in transcribedimage text in transcribedimage text in transcribedimage text in transcribedimage text in transcribedimage text in transcribedimage text in transcribedimage text in transcribedimage text in transcribedimage text in transcribedimage text in transcribedimage text in transcribedimage text in transcribedimage text in transcribedimage text in transcribedimage text in transcribedimage text in transcribed

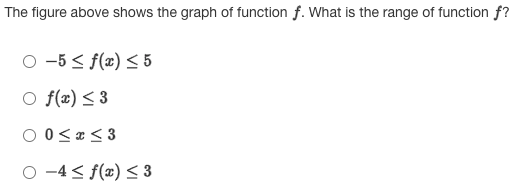
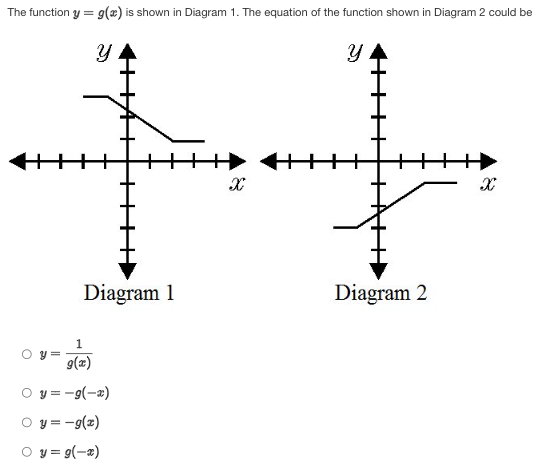
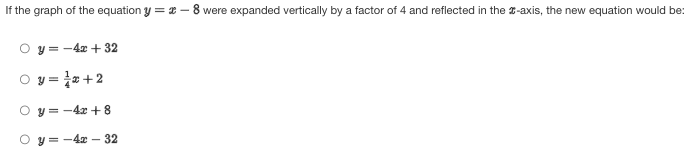
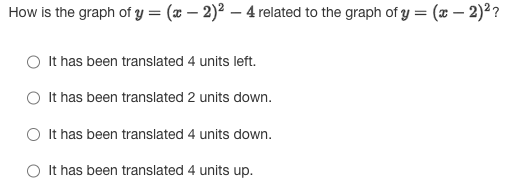
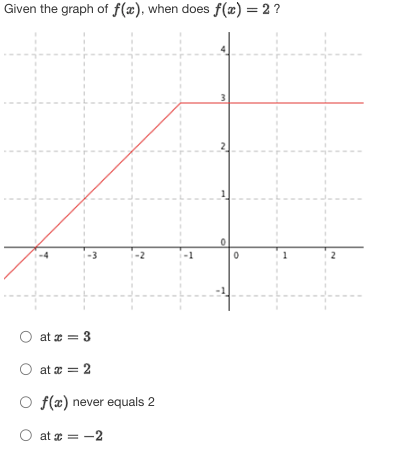
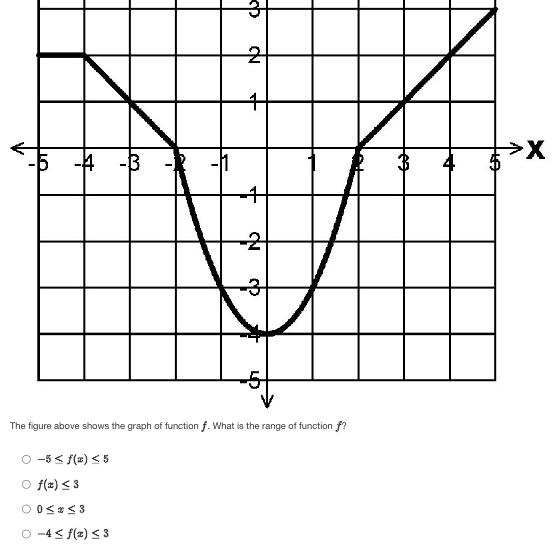
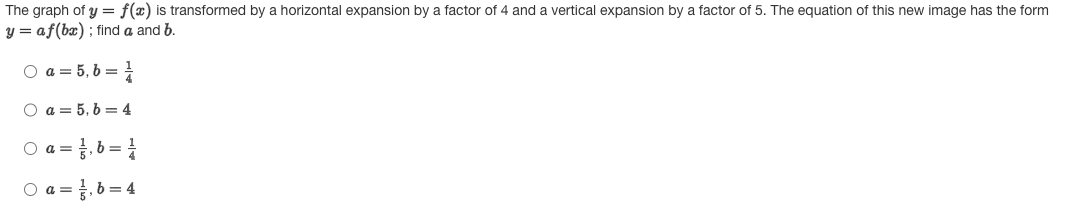
Given the graph of f (@), when does f () = 2? 3 1-2 1 2 O ate = 3 O at a = 2 Of(x) never equals 2 O atx = -2N -4 -3 > X The figure above shows the graph of function f. What is the range of function f? 0 -5 > - 1 in the y-axis, its equation would be Oy c+1 O y= - c- 1 Oy=-2x-1 Outx-1The function y = g() is shown in Diagram 1. The equation of the function shown in Diagram 2 could be y + H Diagram 1 Diagram 2 1 O y= 9() O y= -9(-#) Oy= -g(x) O y = g(-#)If the graph of the equation y = a 3 were expanded vertically by a factor of 4 and reflected in the I-axie. the new equation weuld be: D y=4:e+32 L": y=%m+2 '3' y=-4E+B D y=4m32 The graph of y = f() is transformed by a horizontal expansion by a factor of 4 and a vertical expansion by a factor of 5. The equation of this new image has the form y = af(bx) ; find a and b. O a = 5, b = _ O a = 5,b = 4 O a = =, b = O a= -,b=4How is the graph of y = (@ - 2) - 4 related to the graph of y = ( C

Step by Step Solution

There are 3 Steps involved in it

1 Expert Approved Answer
Step: 1 Unlock blur-text-image
Question Has Been Solved by an Expert!

Get step-by-step solutions from verified subject matter experts

Step: 2 Unlock
Step: 3 Unlock

Students Have Also Explored These Related Mathematics Questions!