

Question: Given the graph of Y=f(x), shown as a red dashed curve, drag the green movable points to draw the graph of y=f(-x). Notice that you
Given the graph of Y=f(x), shown as a red dashed curve, drag the green movable points to draw the graph of y=f(-x). Notice that you can control the positioning of the reflection function with the coordinate labeled "Drag Function" and control the width of the reflection with the coordinate labeled "Control Width".
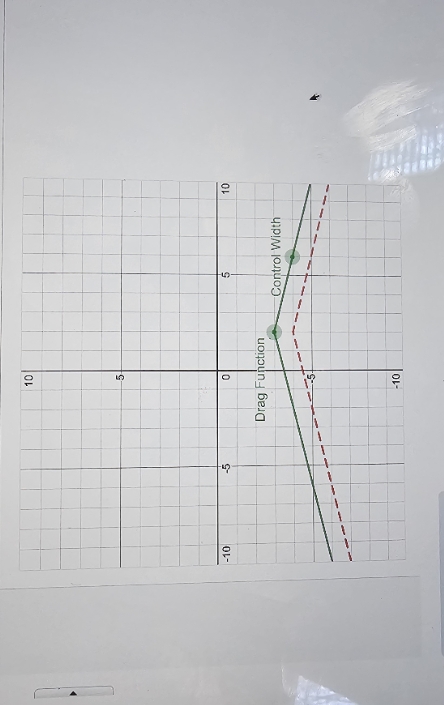
-10 Drag Function Control Width
Step by Step Solution
There are 3 Steps involved in it
1 Expert Approved Answer
Step: 1 Unlock

Question Has Been Solved by an Expert!
Get step-by-step solutions from verified subject matter experts
Step: 2 Unlock
Step: 3 Unlock