

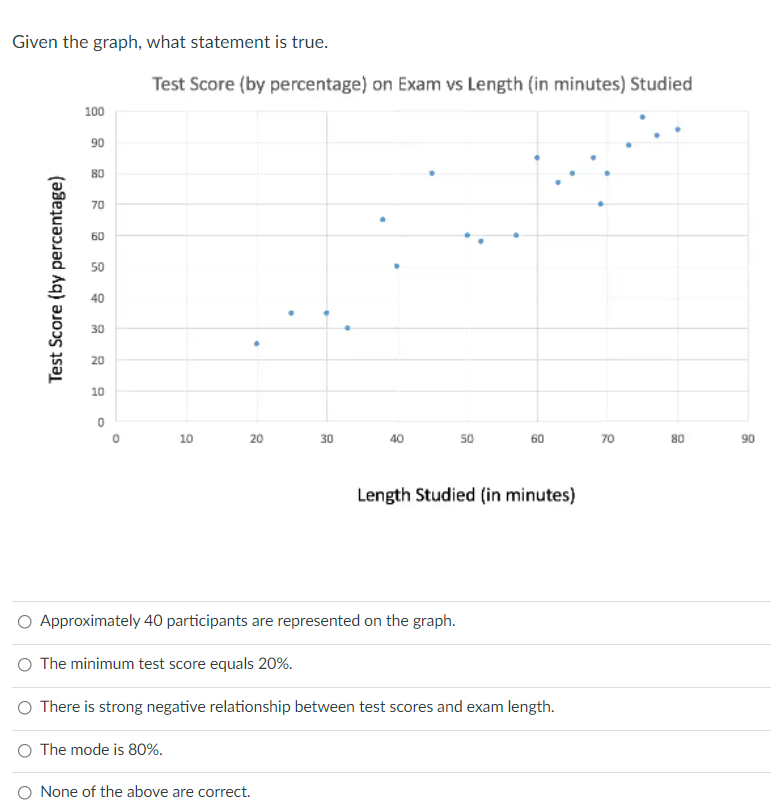
Question: Given the graph, what statement is true. Test Score {by percentage} on Exam vs Length (in minutes) Studied 190 TI] ' 50 ' 20 Test
![on Exam vs Length (in minutes) Studied 190 TI] ' 50 '](https://s3.amazonaws.com/si.experts.images/answers/2024/06/6674a789caf3b_0976674a789a545b.jpg)
Given the graph, what statement is true. Test Score {by percentage} on Exam vs Length (in minutes) Studied 190 TI] ' 50 ' 20 Test Score {by percentage} 1|] Length Studied (in minutes} 0 Approximately 40 participants are represented on the graph. 0 The minimum test score equals 20%. Q There is strong negative relationship between test scores and exam length. 0 The mode is 30%. 0 None of the above are correct
Step by Step Solution
There are 3 Steps involved in it
1 Expert Approved Answer
Step: 1 Unlock

Question Has Been Solved by an Expert!
Get step-by-step solutions from verified subject matter experts
Step: 2 Unlock
Step: 3 Unlock