

Question: Given the graphs above, calculate the total fixed costs, variable costs per unit, and sales price for Firm A. Firm B's fixed costs are $120,000,
|
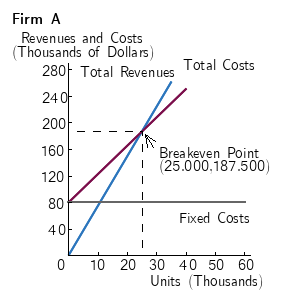
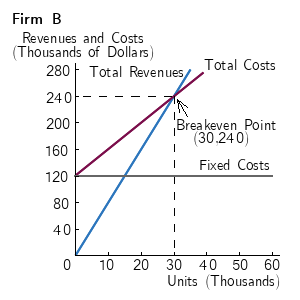 Given the graphs above, calculate the total fixed costs, variable costs per unit, and sales price for Firm A. Firm B's fixed costs are $120,000, its variable costs per unit are $4, and its sales price is $8 per unit. Round your answers to the nearest cent.
Firm A Revenues and Costs (Thousands of Dollars) 280 Total Revenues 240F Total Costs 2001 160 120 Breakeven Point 25.000,187.500) 80 | Fixed Costs 40 I I 0 0 10 20 30 40 50 60 Units (Thousands) Firm B Revenues and Costs (Thousands of Dollars) 280 Total Revenues Total Costs 2405 200 Breakeven Point (30.240) 160 Fixed Costs 120 I I 80 | 40 1 0 0 10 20 30 40 50 60 Units (Thousands
Step by Step Solution
There are 3 Steps involved in it
1 Expert Approved Answer
Step: 1 Unlock

Question Has Been Solved by an Expert!
Get step-by-step solutions from verified subject matter experts
Step: 2 Unlock
Step: 3 Unlock