

Question: Given the image above, how would you add to this chart Compary Sales data of lastyear? pitzitie( Company Sales data of last year'? pit xaxis(Company
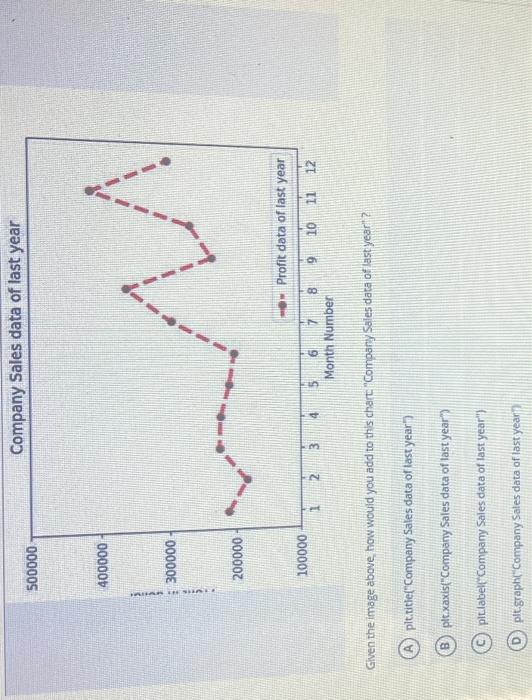
Given the image above, how would you add to this chart" "Compary Sales data of lastyear"? pitzitie( Company Sales data of last year'? pit xaxis("Company Sales data of last year"? pitiabel(" Company Sales data of last year") plt graph( Company Sales data of last year
Step by Step Solution
There are 3 Steps involved in it
1 Expert Approved Answer
Step: 1 Unlock

Question Has Been Solved by an Expert!
Get step-by-step solutions from verified subject matter experts
Step: 2 Unlock
Step: 3 Unlock