

Question: Given the image below, determine the best possible explanation for the correlation. Note : r = -0.89 Efficiency of Automobiles 35 30 y = -1.6564x
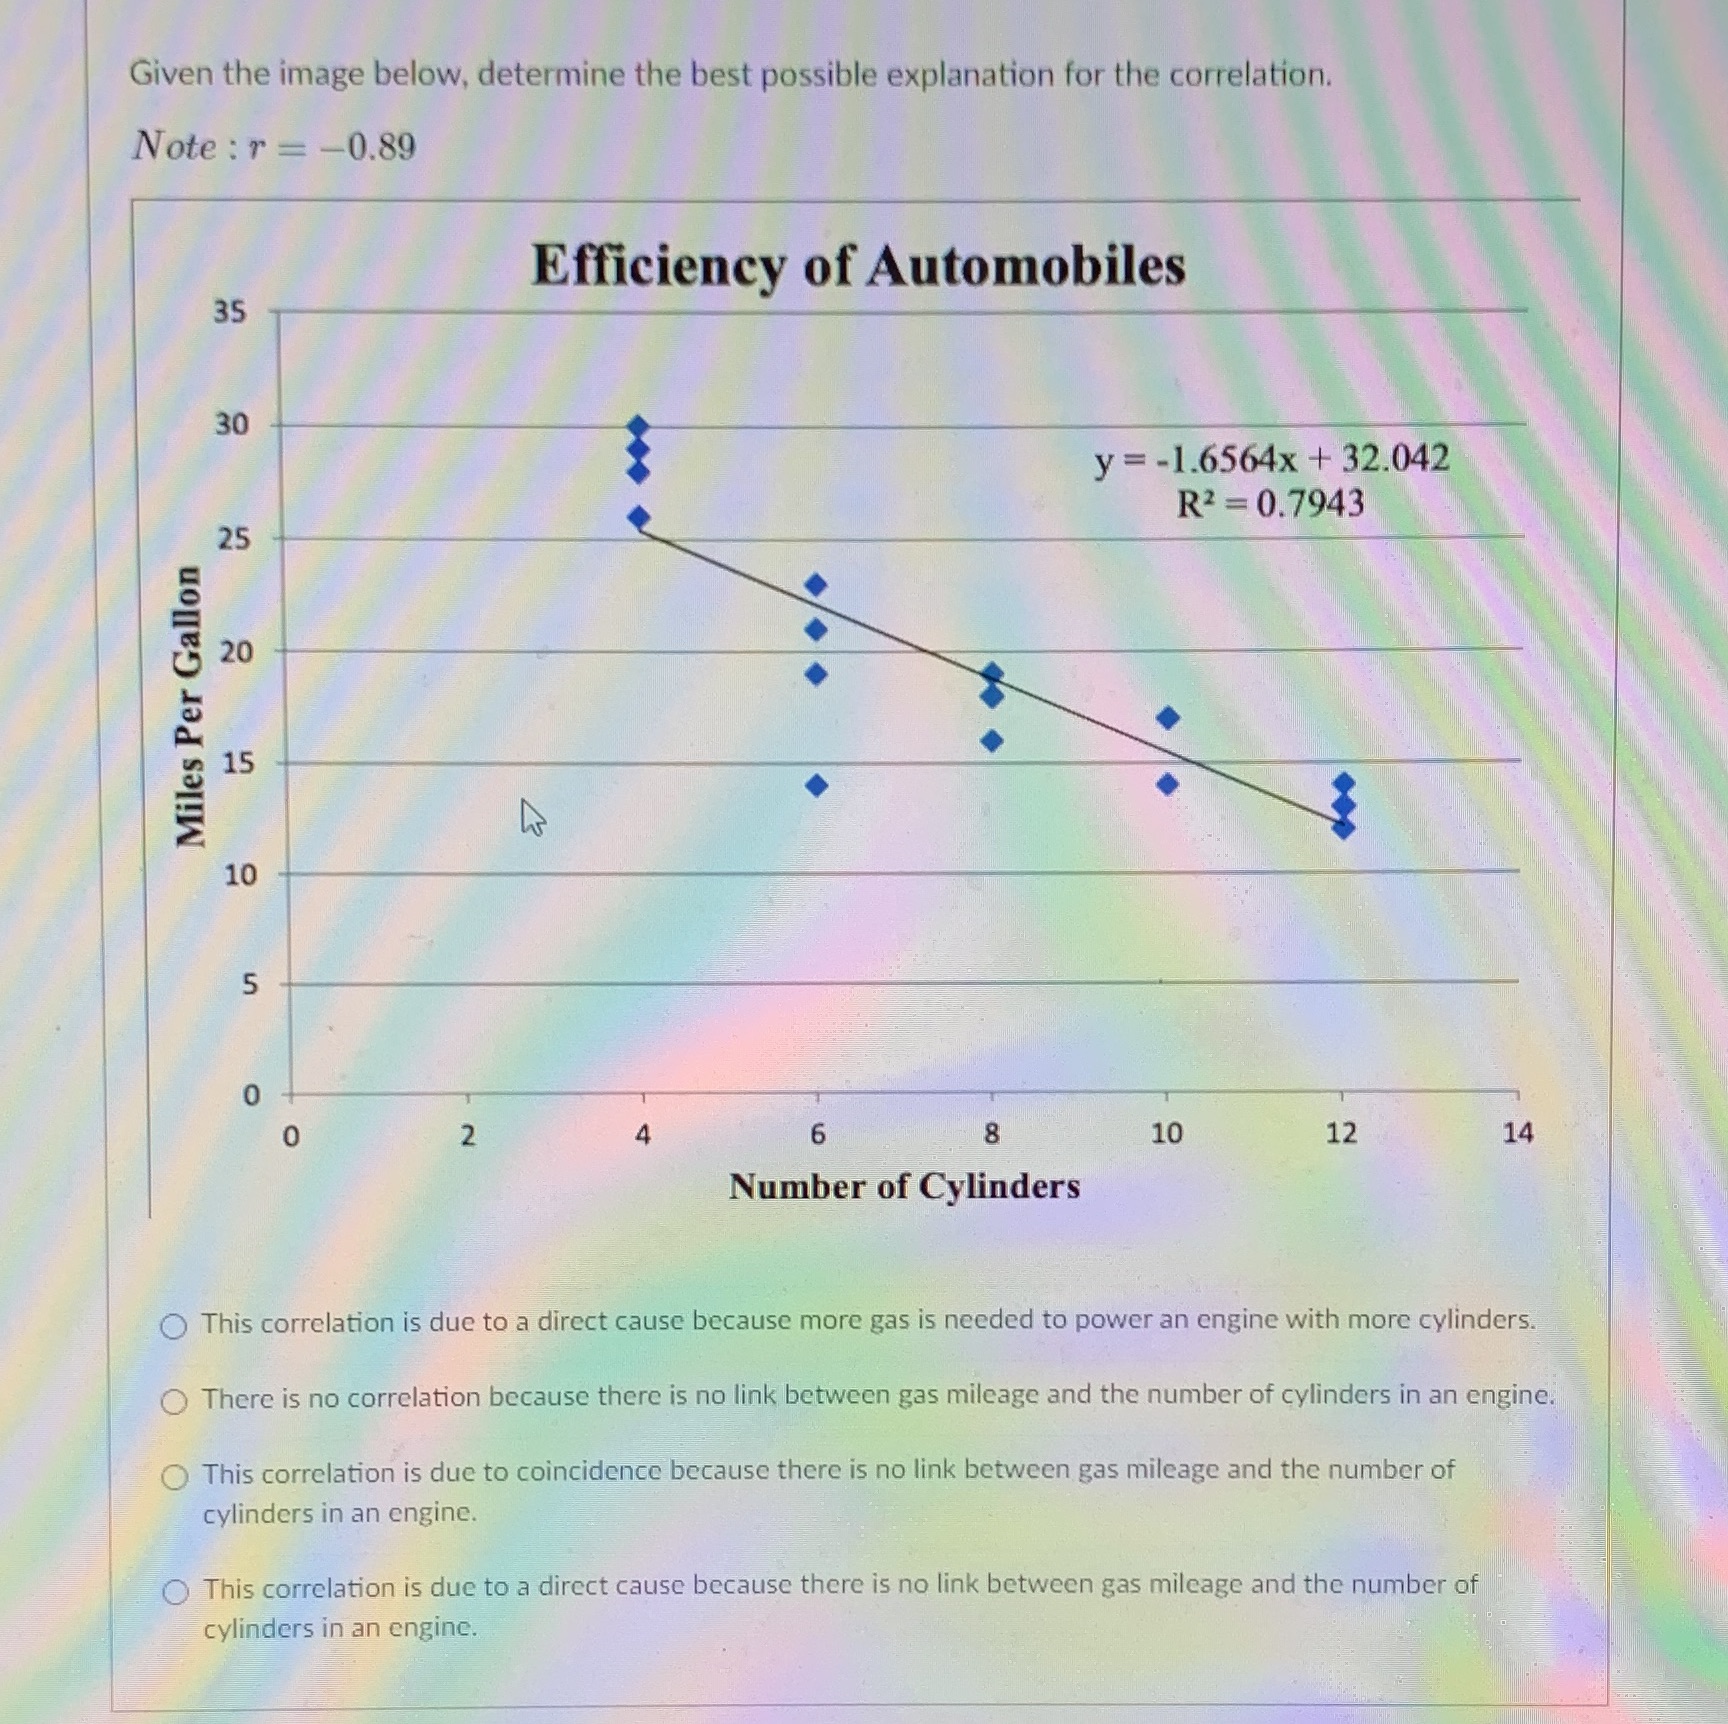

Given the image below, determine the best possible explanation for the correlation. Note : r = -0.89 Efficiency of Automobiles 35 30 y = -1.6564x + 32.042 R2 = 0.7943 25 20 Miles Per Gallon 15 10 5 4 6 8 10 12 14 Number of Cylinders This correlation is due to a direct cause because more gas is needed to power an engine with more cylinders. There is no correlation because there is no link between gas mileage and the number of cylinders in an engine. This correlation is due to coincidence because there is no link between gas mileage and the number of cylinders in an engine. O This correlation is due to a direct cause because there is no link between gas mileage and the number of cylinders in an engine
Step by Step Solution
There are 3 Steps involved in it

Get step-by-step solutions from verified subject matter experts