

Question: Given the information below. Does the Age influence the Time? Please interpret the results of the hypothesis. The regression equation is TIME (MINUTES) = -
Given the information below. Does the Age influence the Time? Please interpret the results of the hypothesis.
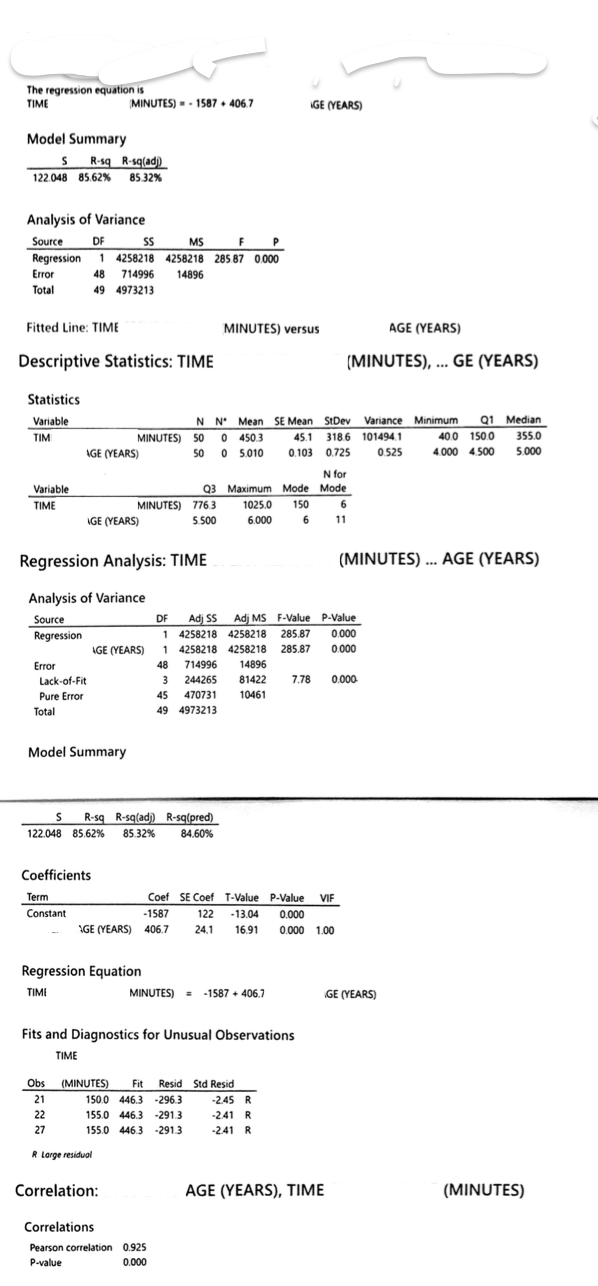
The regression equation is TIME (MINUTES) = - 1587 + 406.7 IGE (YEARS) Model Summary R-sq R-sqladi 122.048 85.62% 85.32% Analysis of Variance Source DF SS MS Regression 4258218 4258218 285.87 0.000 Error 714996 14896 Total 49 4973213 Fitted Line: TIME MINUTES) versus AGE (YEARS) Descriptive Statistics: TIME (MINUTES), ... GE (YEARS) Statistics Variable N N' Mean SE Mean StDev Variance Minimum Q1 Median TIM MINUTES) 50 450.3 45.1 318.6 101494.1 40.0 150.0 355.0 AGE (YEARS) 50 5.010 0.103 0.725 0.525 4.000 4.500 5.000 N for Variable Q3 Maximum Mode Mode TIME MINUTES) 776.3 1025.0 150 IGE (YEARS) 5.500 6.000 Regression Analysis: TIME (MINUTES) ... AGE (YEARS) Analysis of Variance Source DF Adj SS Adj MS F-Value P-Value Regression 4258218 4258218 285.87 0.000 AGE (YEARS) 4258218 4258218 285.87 0.000 Error 48 714996 14896 Lack-of-Fit 244265 81422 7.78 0.000 Pure Error 45 470731 10461 Total 4973213 Model Summary S R-sq R-sq(adi R-sq(pred) 122.048 85.62% 85.32% 84.60% Coefficients Term Coef SE Coef T-Value P-Value Constant -1587 122 -13.04 0.000 AGE (YEARS) 406.7 24.1 16.91 0.000 1.00 Regression Equation TIME MINUTES) -1587 + 406.7 GE (YEARS) Fits and Diagnostics for Unusual Observations TIME Obs (MINUTES) Fit Resid Std Resid 21 150.0 446.3 -296.3 -2.45 22 155.0 446.3 -291.3 -241 R 155.0 446.3 -291.3 -241 R R Large residual Correlation: AGE (YEARS), TIME (MINUTES) Correlations Pearson correlation 0.925 000'0 P-value
Step by Step Solution
There are 3 Steps involved in it

Get step-by-step solutions from verified subject matter experts