

Question: Given the information below for Exxon Mobil (XOM). Compute the expected share price at the end of 2018 using only Price/EPS ratio analysis (10 points)
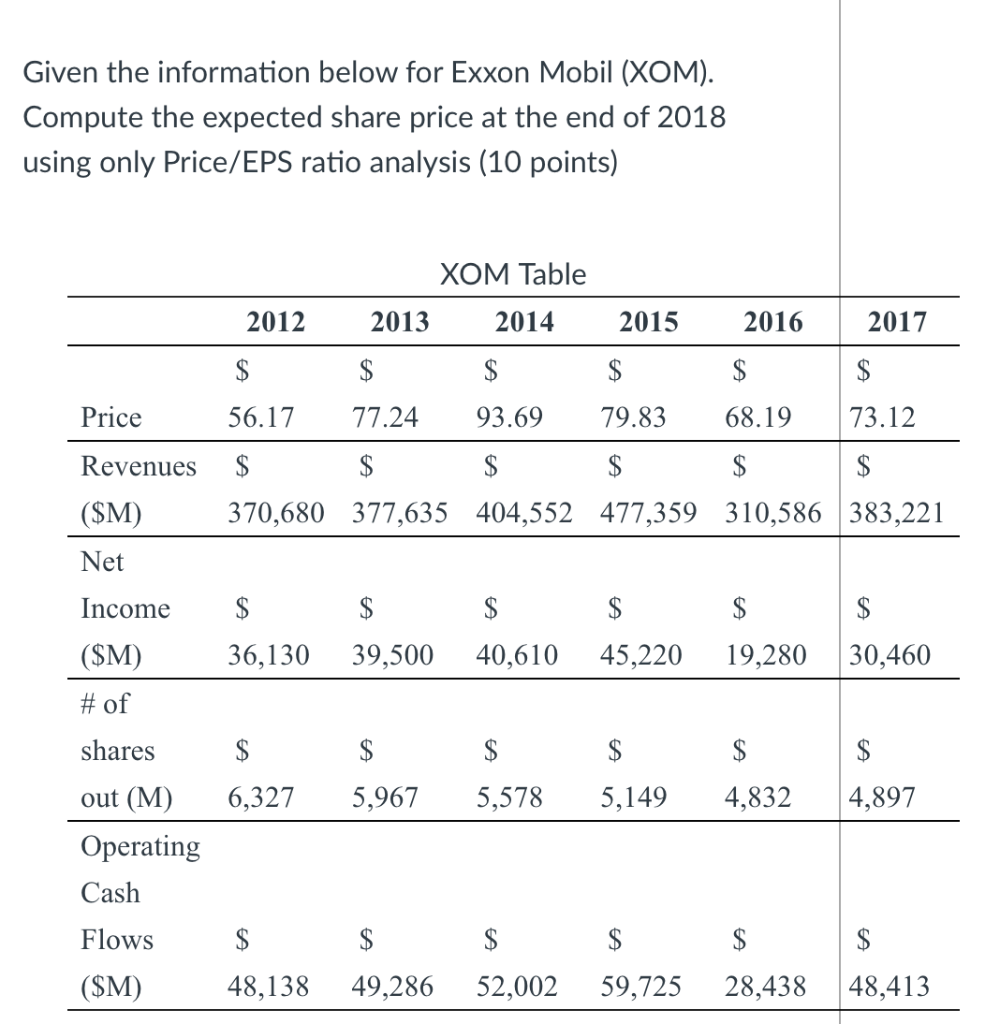
Given the information below for Exxon Mobil (XOM). Compute the expected share price at the end of 2018 using only Price/EPS ratio analysis (10 points) XOM Table 2012 2013 2014 2015 2016 2017 $ $ $ $ $ $ 68.19 Price 56.17 77.24 93.69 79.83 73.12 Revenues $ $ $ $ $ ($M) 370,680 377,635 404,552 477,359 310,586 383,221 Net Income $ $ $ $ $ $ 36,130 39,500 40,610 45,220 19,280 30,460 ($M) # of shares $ $ $ $ $ $ 6,327 5,967 5,578 5,149 4,832 4,897 out (M) Operating Cash Flows ($M) $ $ $ $ $ $ 48,138 49,286 52,002 59,725 28,438 48,413
Step by Step Solution
There are 3 Steps involved in it
1 Expert Approved Answer
Step: 1 Unlock

Question Has Been Solved by an Expert!
Get step-by-step solutions from verified subject matter experts
Step: 2 Unlock
Step: 3 Unlock