

Question: Given the information below for Seger Corporation, compute the expected share price at the end of 2017 using price ratio analysis. Assume that the historical
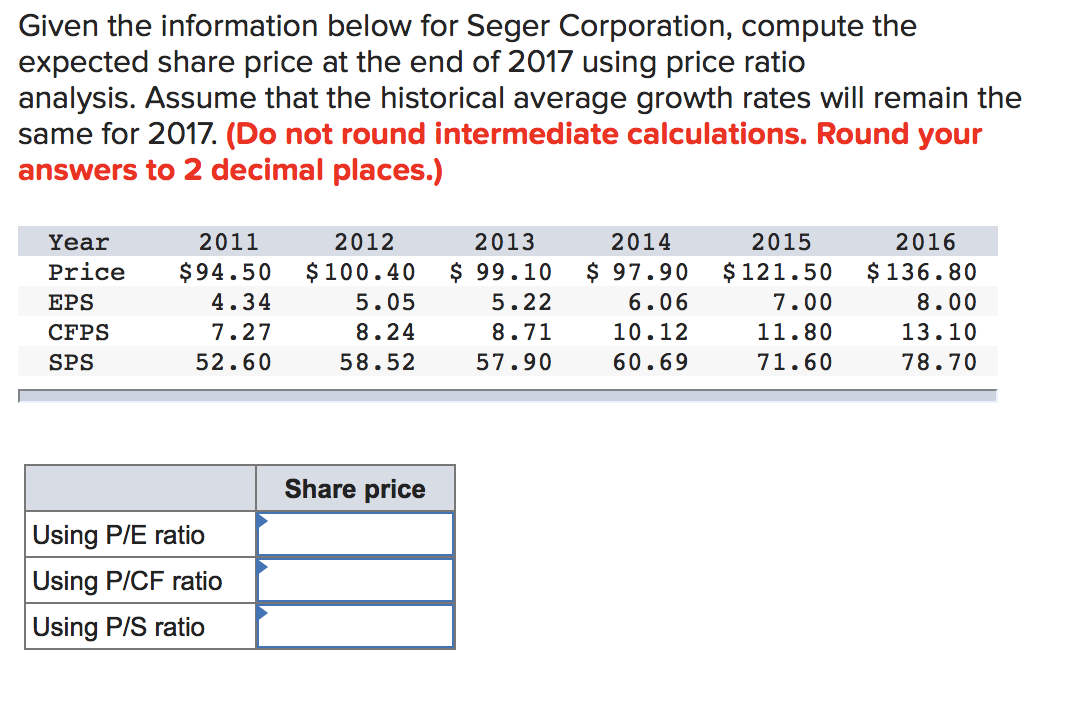
Given the information below for Seger Corporation, compute the expected share price at the end of 2017 using price ratio analysis. Assume that the historical average growth rates will remain the same for 2017. (Do not round intermediate calculations. Round your answers to 2 decimal places.) Year Price EPS CFPS SPS 2011 $94.50 4.34 7.27 52.60 2012 $ 100.40 5.05 8.24 58.52 2013 $ 99.10 5.22 8.71 57.90 2014 $ 97.90 6.06 10.12 60.69 2015 $121.50 7.00 11.80 71.60 2016 $136.80 8.00 13.10 78.70 Share price Using P/E ratio Using P/CF ratio Using P/S ratio
Step by Step Solution
There are 3 Steps involved in it
1 Expert Approved Answer
Step: 1 Unlock

Question Has Been Solved by an Expert!
Get step-by-step solutions from verified subject matter experts
Step: 2 Unlock
Step: 3 Unlock