

Question: Given the information in the excel image, use a data table to show how the price of this bond changes for different coupon rates and
Given the information in the excel image, use a data table to show how the price of this bond changes for different coupon rates and different yields to maturity. Show that interest rate risk is inversely related to the bonds coupon rate.
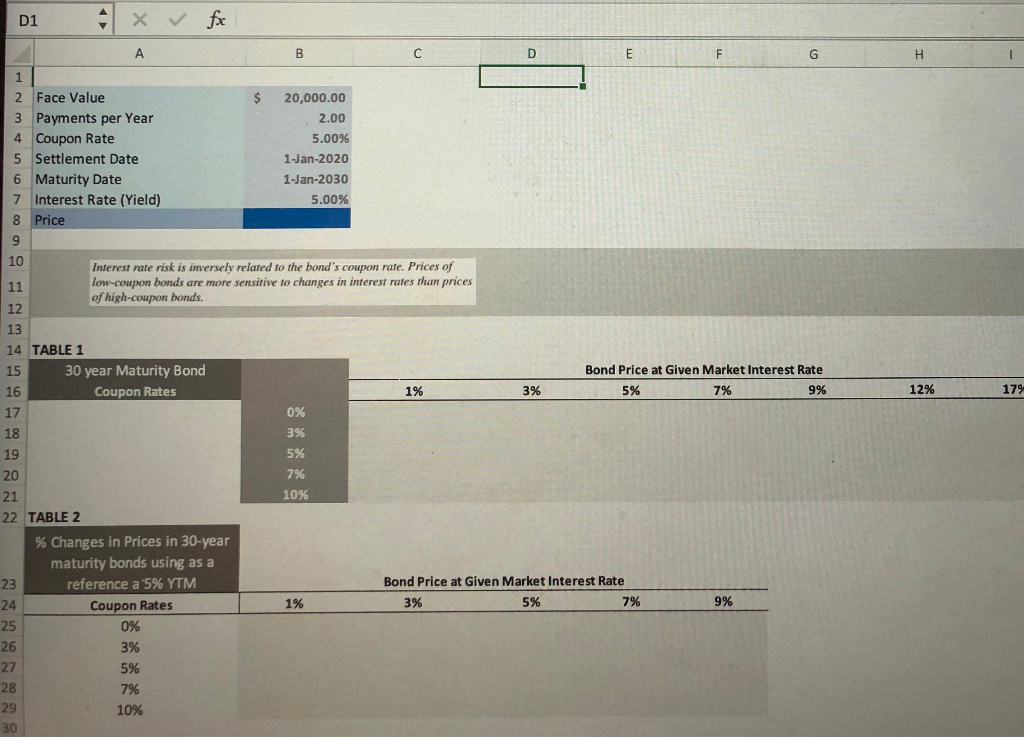
DI + x fx $ 2 Face Value 3 Payments per Year 4 Coupon Rate 5 Settlement Date 6 Maturity Date 7 Interest Rate (Yield) 8 Price 20,000.00 2.00 5.00% 1-Jan-2020 1-Jan-2030 5.00% Interest rate risk is inversely related to the bond's coupon rate. Prices of low-coupon bonds are more sensitive to changes in interest rates than prices of high-coupon bonds. 14 TABLE 1 30 year Maturity Bond Coupon Rates Bond Price at Given Market Interest Rate 5% 7% 9% 3% 12% 17% 22 TABLE 2 % Changes in Prices in 30-year maturity bonds using as a reference a 5% YTM Coupon Rates 0% 3% Bond Price at Given Market Interest Rate 3% 5% 7% 1% 9% 5% 7% 10%
Step by Step Solution
There are 3 Steps involved in it

Get step-by-step solutions from verified subject matter experts