

Question: Given the line charts below, which chart correctly represents the table of production numbers for the automotive manufacturere? A. Chart A A. Chart B
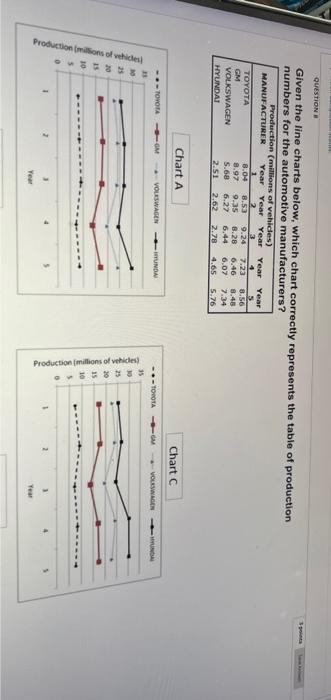
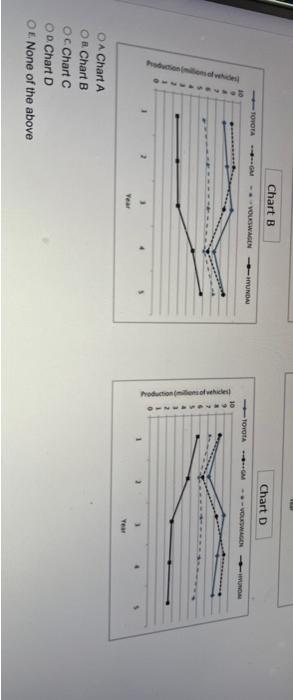
Given the line charts below, which chart correctly represents the table of production numbers for the automotive manufacturere? A. Chart A A. Chart B
Step by Step Solution
There are 3 Steps involved in it
1 Expert Approved Answer
Step: 1 Unlock

Question Has Been Solved by an Expert!
Get step-by-step solutions from verified subject matter experts
Step: 2 Unlock
Step: 3 Unlock