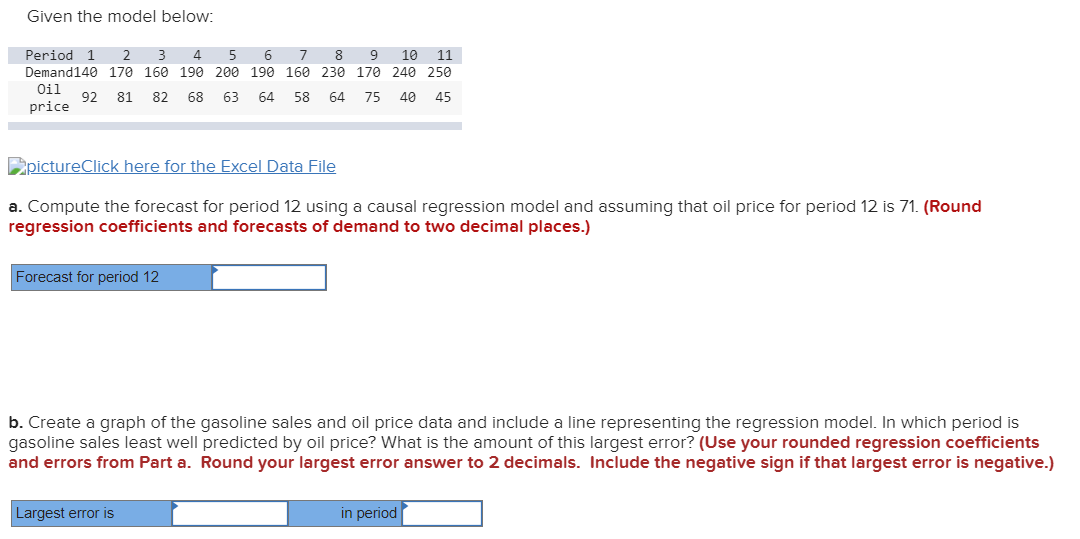
Question: Given the model below: Period 1 2 3 4 5 6 7 8 9 10 11 Demand140 170 160 190 200 190 160 230 170

Given the model below: Period 1 2 3 4 5 6 7 8 9

Given the model below: Period 1 2 3 4 5 6 7 8 9 10 11 Demand140 170 160 190 200 190 160 230 170 240 250 Oil 92 81 82 68 63 64 58 64 75 40 45 price pictureClick here for the Excel Data File a. Compute the forecast for period 12 using a causal regression model and assuming that oil price for period 12 is 71. (Round regression coefficients and forecasts of demand to two decimal places.) Forecast for period 12 b. Create a graph of the gasoline sales and oil price data and include a line representing the regression model. In which period is gasoline sales least well predicted by oil price? What is the amount of this largest error? (Use your rounded regression coefficients and errors from Part a. Round your largest error answer to 2 decimals. Include the negative sign if that largest error is negative.) Largest error is in period

Step by Step Solution

There are 3 Steps involved in it

1 Expert Approved Answer
Step: 1 Unlock blur-text-image
Question Has Been Solved by an Expert!

Get step-by-step solutions from verified subject matter experts

Step: 2 Unlock
Step: 3 Unlock

Students Have Also Explored These Related General Management Questions!