

Question: Given the model below: Period 1 2. 3 4 5 6 7 8 9 10 11 Demand 150 180 200 190 210 170 190 190
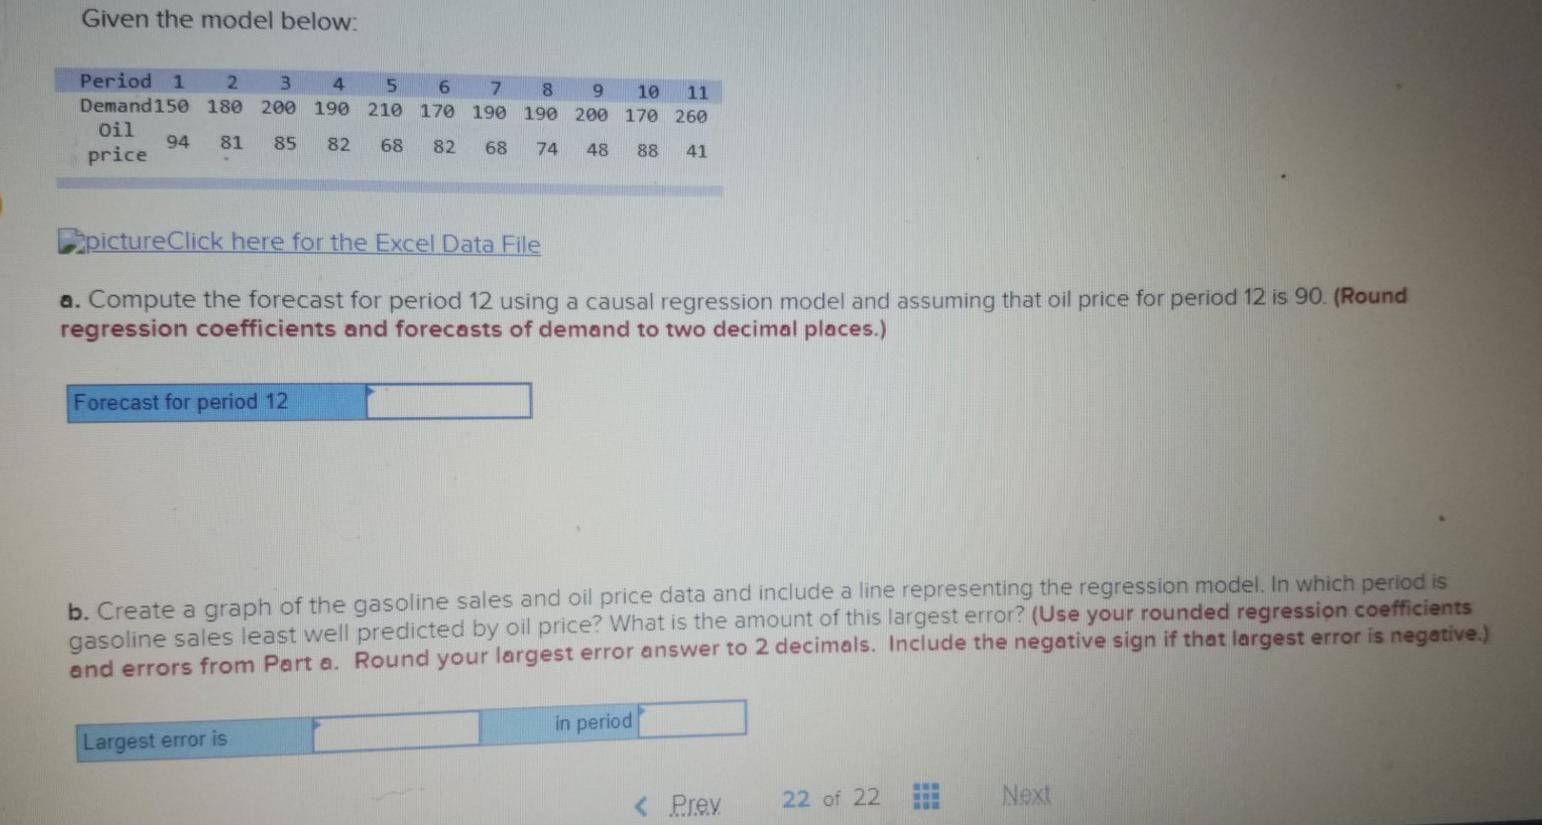
Given the model below: Period 1 2. 3 4 5 6 7 8 9 10 11 Demand 150 180 200 190 210 170 190 190 200 170 260 Oil 94 81 85 82 68 82 price 68 74 48 88 41 pictureClick here for the Excel Data File a. Compute the forecast for period 12 using a causal regression model and assuming that oil price for period 12 is 90. (Round regression coefficients and forecasts of demand to two decimal places.) Forecast for period 12 b. Create a graph of the gasoline sales and oil price data and include a line representing the regression model. In which period is gasoline sales least well predicted by oil price? What is the amount of this largest error? (Use your rounded regression coefficients and errors from Part a. Round your largest error answer to 2 decimals. Include the negative sign if that largest error is negative.) in period Largest error is
Step by Step Solution
There are 3 Steps involved in it
1 Expert Approved Answer
Step: 1 Unlock

Question Has Been Solved by an Expert!
Get step-by-step solutions from verified subject matter experts
Step: 2 Unlock
Step: 3 Unlock