

Question: Given the original dataset and optimal regional network configuration solution above, please answer the questions for the following scenario : Every market must have at
Given the original dataset and optimal regional network configuration solution above, please answer the questions for the following scenario:
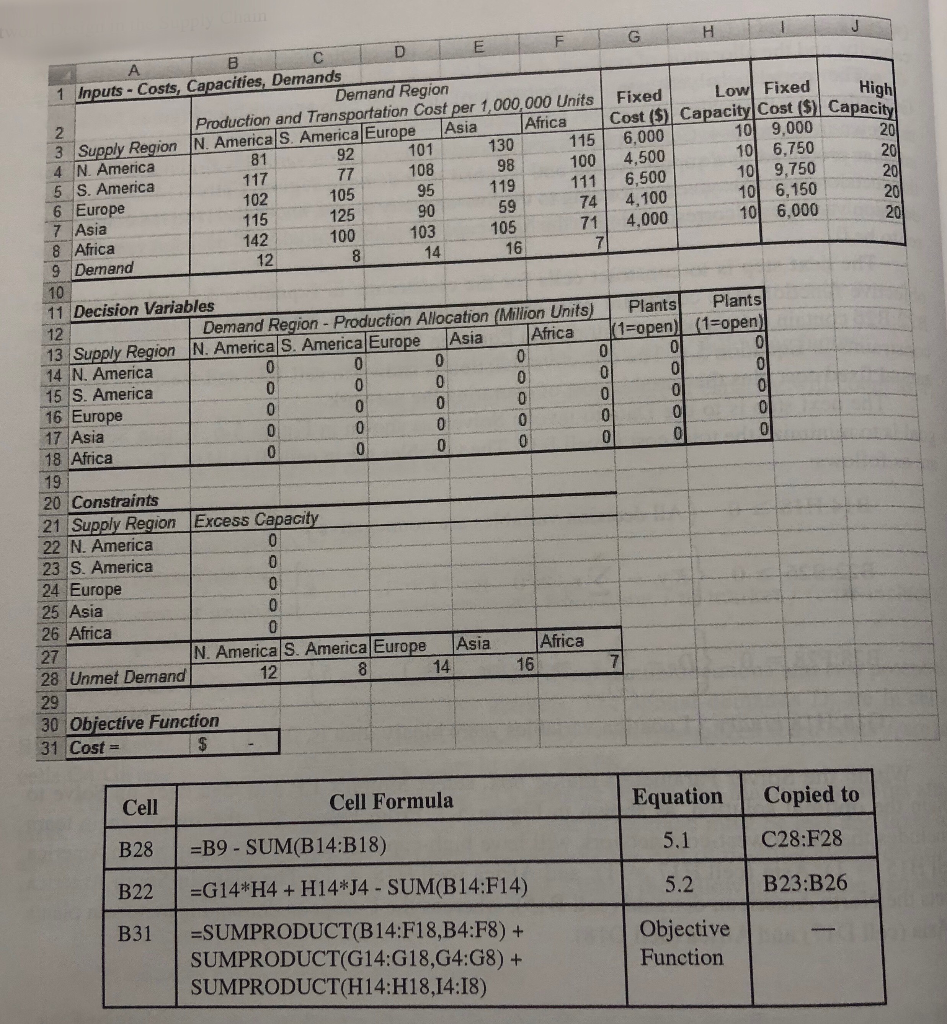
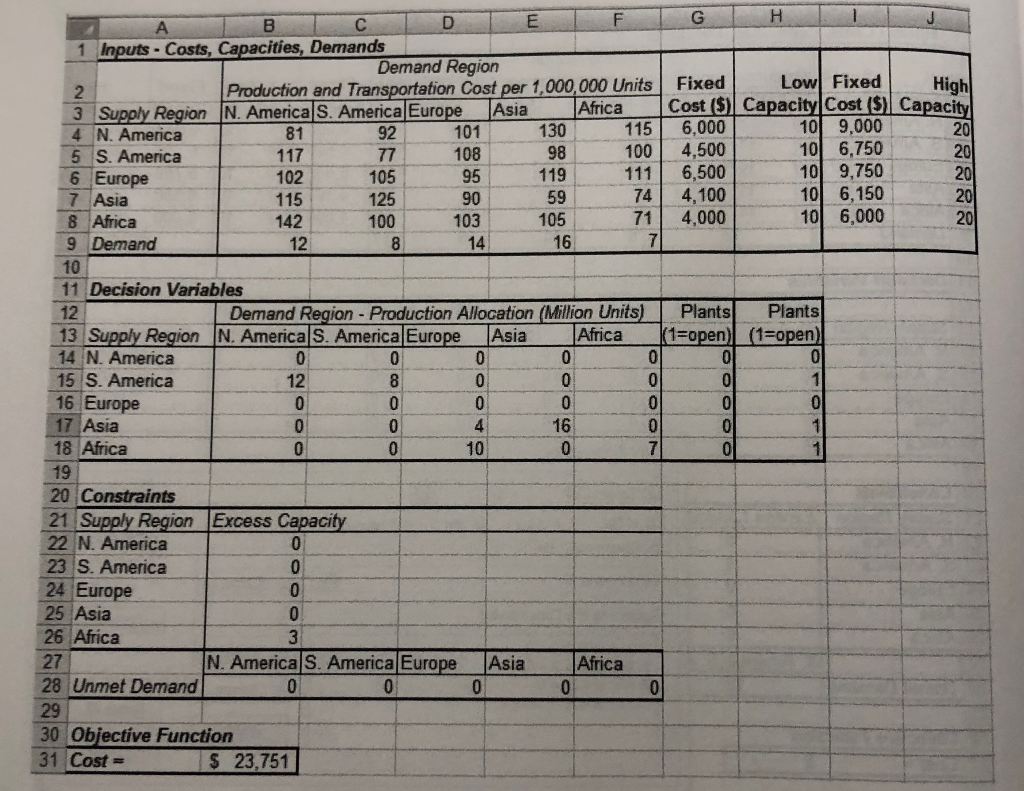
Every market must have at least one plant:
a) How much would be your new cost?
b) In which markets do you have a high capacity plant and in which markets do you have a low capacity plant?
HIJ High 81 Fixed Low Fixed Cost ($) Capacity Cost ($) Capacity 6,000 109,000 4,500 101 6.750 6,500 10 9.750 4,100 101 6,150 4,000 10 6,000 11 95 115 71/ 103 16 Plants 1=open) Plants (1=open) CTD 1 Inputs - Costs, Capacities, Demands Demand Region Production and Transportation Cost per 1,000,000 Units Africa Asia N. America S. America Europe 3 Supply Region 101 92 115 130 4 N. America 98 108 100 117 5 S. America 119 105 111 102 6 Europe 125 90 59 74 7 Asia 100 105 142 8 Africa 9 Demand 12 10 11 Decision Variables 12 Demand Region - Production Allocation (Million Units) 13 Supply Region N. America S. America Europe Africa Asia 14 N. America 15 S. America 16 Europe 17 Asia 18 Africa 19 20 Constraints 21 Supply Region Excess Capacity 22 N. America 23 S. America 24 Europe 25 Asia 26 Africa N. America S. America Europe Asia Africa 28 Unmet Demand 12 16 29 30 Objective Function 31 Cost = $ OOOOO Oooo 27 Cell Formula Equation Cell Copied to 5.1 B28 C28:F28 B22 5.2 B23:B26 =B9 - SUM(B14:B18) =G14*H4 + H14*J4 - SUM(B14:F14) =SUMPRODUCT(B14:F18,B4:F8) + SUMPRODUCT(G14:G18,64:G8) + SUMPRODUCT(H14:H18,14:18) B31 Objective Function High 77 98 102 105 59 142 G H E D 1 A B C 1 Inputs - Costs, Capacities, Demands Demand Region Production and Transportation Cost per 1,000,000 Units Fixed Low Fixed 3 Supply Region IN. America S. America Europe Asia Africa Cost ($) Capacity Cost ($) Capacitul 4 N. America 81 92 101 130 115 6,000 10 9,000 5 S. America 117 108 100 4,500 106,750 6 Europe 95 119 111 6,500 10 9.750 7 Asia 115 125 90 74 4,100 10 6,150 8 Africa 100 103 105 71 4,000 10 6,000 9 Demand 10 11 Decision Variables 12 Demand Region - Production Allocation (Million Units) Plants Plants 13 Supply Region IN. America S. America Europe Asia Africa (1=open) (1=open) 14 N. America 15 S. America 16 Europe 17 Asia 18 Africa 12 8 14 16 Co o OGORO > 19 0 20 Constraints 21 Supply Region Excess Capacity 22 N. America 0 23 S. America 24 Europe 25 Asia 26 Africa N. America S. America Europe 28 Unmet Demand 0 0 29 30 Objective Function 31 Cost = $ 23,751 27 Asia 0 Africa 0 0 HIJ High 81 Fixed Low Fixed Cost ($) Capacity Cost ($) Capacity 6,000 109,000 4,500 101 6.750 6,500 10 9.750 4,100 101 6,150 4,000 10 6,000 11 95 115 71/ 103 16 Plants 1=open) Plants (1=open) CTD 1 Inputs - Costs, Capacities, Demands Demand Region Production and Transportation Cost per 1,000,000 Units Africa Asia N. America S. America Europe 3 Supply Region 101 92 115 130 4 N. America 98 108 100 117 5 S. America 119 105 111 102 6 Europe 125 90 59 74 7 Asia 100 105 142 8 Africa 9 Demand 12 10 11 Decision Variables 12 Demand Region - Production Allocation (Million Units) 13 Supply Region N. America S. America Europe Africa Asia 14 N. America 15 S. America 16 Europe 17 Asia 18 Africa 19 20 Constraints 21 Supply Region Excess Capacity 22 N. America 23 S. America 24 Europe 25 Asia 26 Africa N. America S. America Europe Asia Africa 28 Unmet Demand 12 16 29 30 Objective Function 31 Cost = $ OOOOO Oooo 27 Cell Formula Equation Cell Copied to 5.1 B28 C28:F28 B22 5.2 B23:B26 =B9 - SUM(B14:B18) =G14*H4 + H14*J4 - SUM(B14:F14) =SUMPRODUCT(B14:F18,B4:F8) + SUMPRODUCT(G14:G18,64:G8) + SUMPRODUCT(H14:H18,14:18) B31 Objective Function High 77 98 102 105 59 142 G H E D 1 A B C 1 Inputs - Costs, Capacities, Demands Demand Region Production and Transportation Cost per 1,000,000 Units Fixed Low Fixed 3 Supply Region IN. America S. America Europe Asia Africa Cost ($) Capacity Cost ($) Capacitul 4 N. America 81 92 101 130 115 6,000 10 9,000 5 S. America 117 108 100 4,500 106,750 6 Europe 95 119 111 6,500 10 9.750 7 Asia 115 125 90 74 4,100 10 6,150 8 Africa 100 103 105 71 4,000 10 6,000 9 Demand 10 11 Decision Variables 12 Demand Region - Production Allocation (Million Units) Plants Plants 13 Supply Region IN. America S. America Europe Asia Africa (1=open) (1=open) 14 N. America 15 S. America 16 Europe 17 Asia 18 Africa 12 8 14 16 Co o OGORO > 19 0 20 Constraints 21 Supply Region Excess Capacity 22 N. America 0 23 S. America 24 Europe 25 Asia 26 Africa N. America S. America Europe 28 Unmet Demand 0 0 29 30 Objective Function 31 Cost = $ 23,751 27 Asia 0 Africa 0 0
Step by Step Solution
There are 3 Steps involved in it

Get step-by-step solutions from verified subject matter experts