

Question: Given the parametric equationsx = -t2 - 2 and y = -t+ 4t, where -3 s ts 3, which of the following graphs represents the

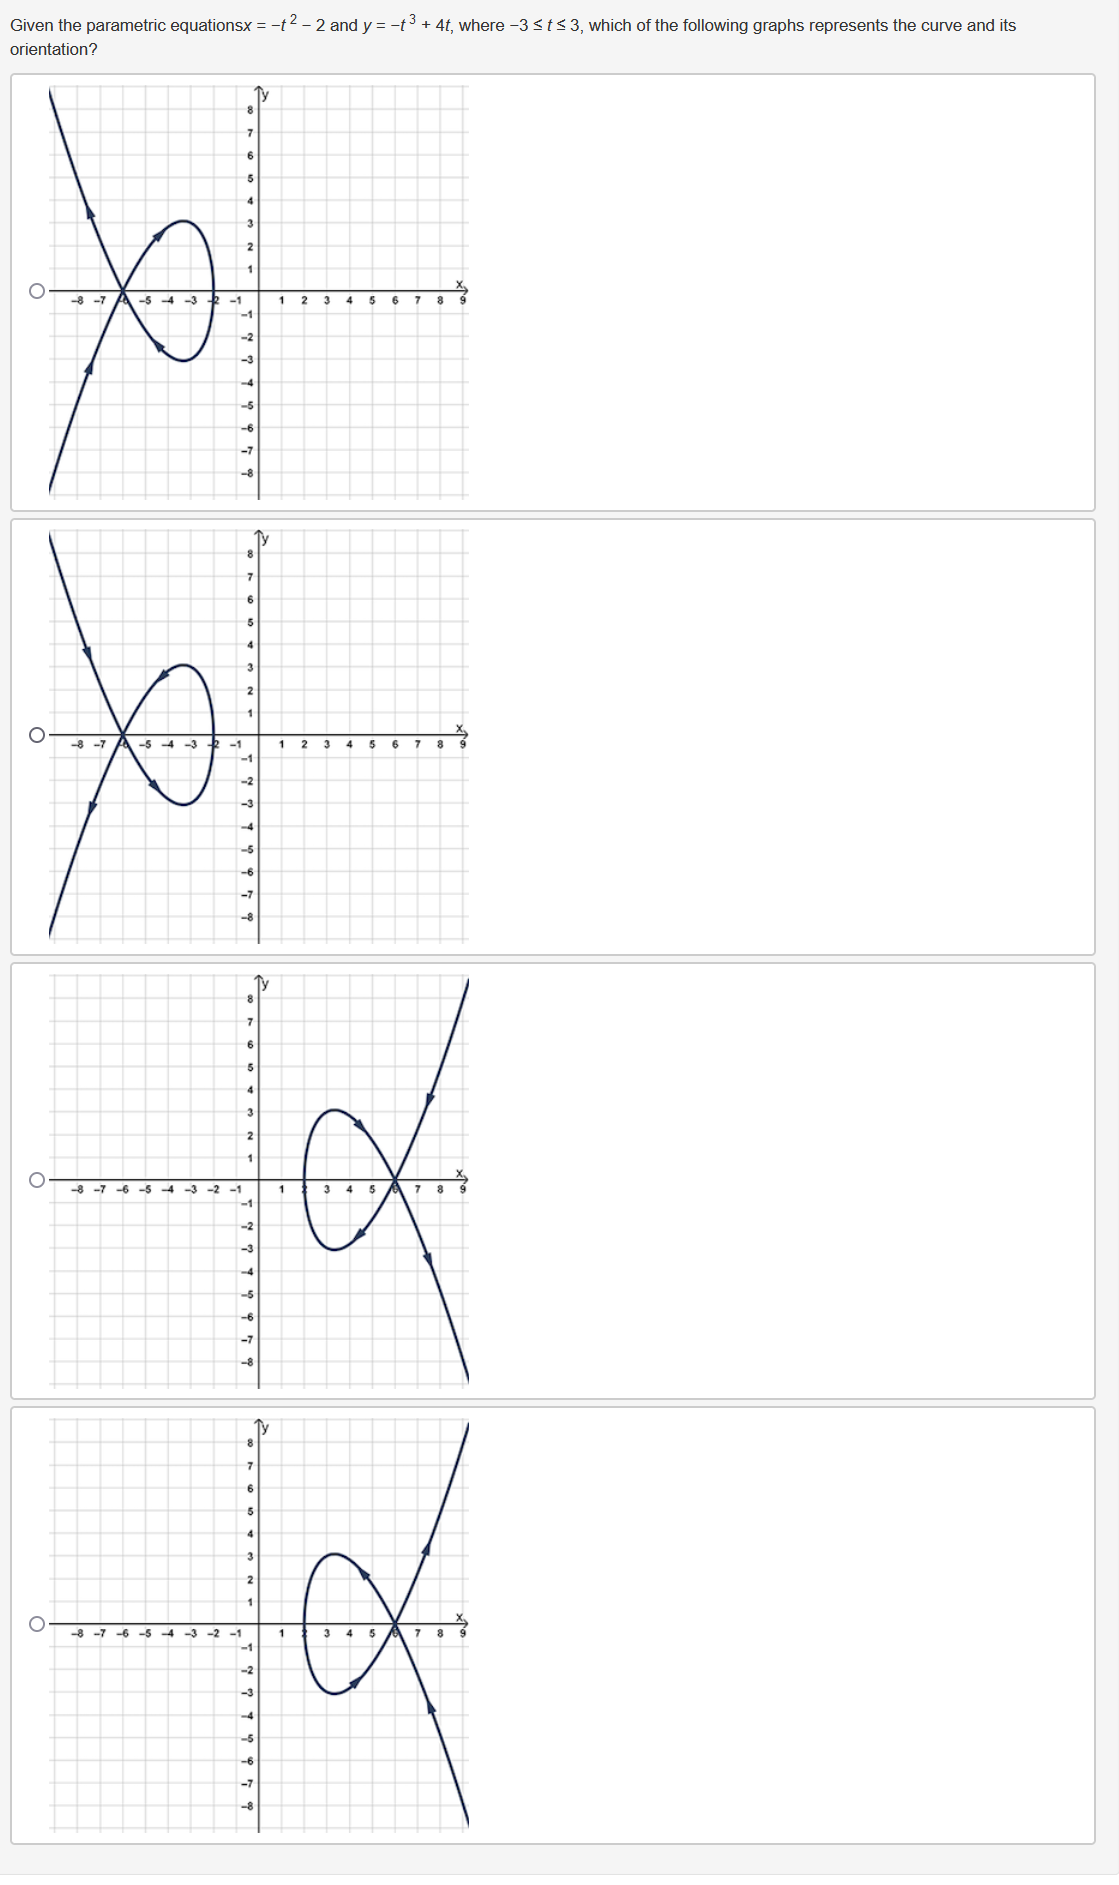
Given the parametric equationsx = -t2 - 2 and y = -t+ 4t, where -3 s ts 3, which of the following graphs represents the curve and its orientation? - N W 2 5 6 7 2 4 5 6 O- -8 -7 -6 -5 -4 -3 -2 -1 7 8 3 O- -8 -7 -6 -5 -4 -3 -2 -1
Step by Step Solution
There are 3 Steps involved in it
1 Expert Approved Answer
Step: 1 Unlock

Question Has Been Solved by an Expert!
Get step-by-step solutions from verified subject matter experts
Step: 2 Unlock
Step: 3 Unlock