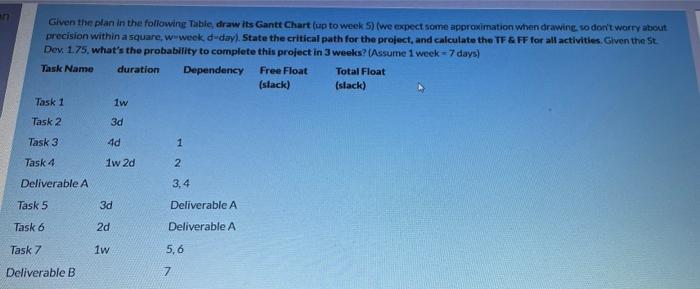
Question: Given the plan in the following Table draw its Gantt Chart (up to week 5) (we expect some approximation when drawing, so don't worry about

Given the plan in the following Table draw its
Given the plan in the following Table draw its Gantt Chart (up to week 5) (we expect some approximation when drawing, so don't worry about precision within a square, w week, d-day). State the critical path for the project, and calculate the TF & FF for all activities. Given the St Dex 1.75, what's the probability to complete this project in 3 weeks? (Assume 1 week - 7 days) Dependency Free Float (slack) (slack) 1w Task Name duration Total Float Task 1 Task 2 3d Task 3 4d 1 Task 4 1w 2d 2 Deliverable A 3,4 Task 5 3d Deliverable A Task 6 2d Deliverable A Task 7 1w 5,6 Deliverable B 7

Step by Step Solution

There are 3 Steps involved in it

1 Expert Approved Answer
Step: 1 Unlock blur-text-image
Question Has Been Solved by an Expert!

Get step-by-step solutions from verified subject matter experts

Step: 2 Unlock
Step: 3 Unlock

Students Have Also Explored These Related General Management Questions!