

Question: Given the problem shown below, create a MatLab code which displays the 3 desired plots. 1 = [0.5, 1.5, 3.0, 4.5, 6.0, 7.5, 9.0] We
Given the problem shown below, create a MatLab code which displays the 3 desired plots. 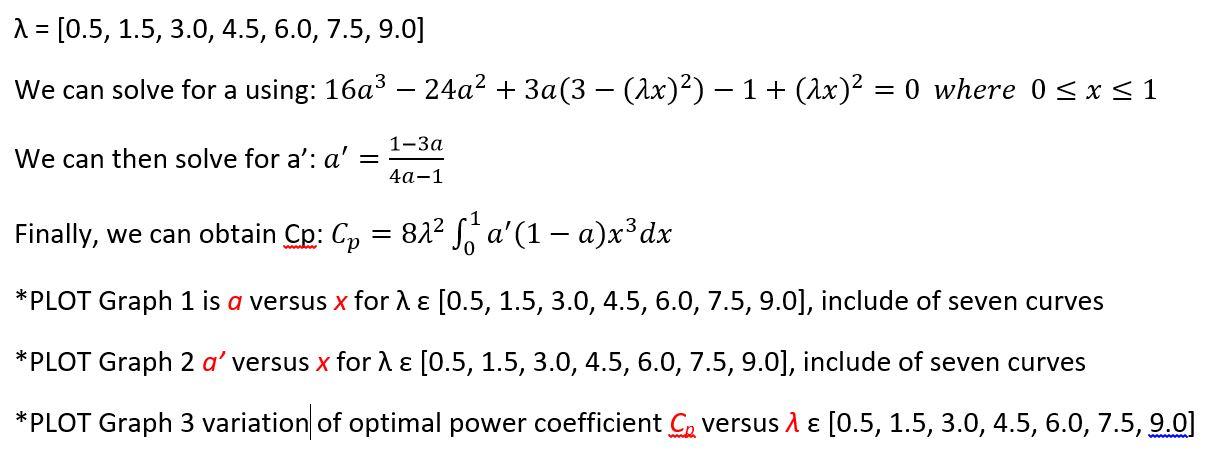
1 = [0.5, 1.5, 3.0, 4.5, 6.0, 7.5, 9.0] We can solve for a using: 16a3 24a2 + 3a(3 (2x)2) - 1 + (2x)2 = 0 where 0 SX S1 1-3a We can then solve for a': a' = 4a-1 Finally, we can obtain Cp: Cp = 822 S*a'(1 a)x3dx *PLOT Graph 1 is a versus x for 1 [0.5, 1.5, 3.0, 4.5, 6.0, 7.5, 9.0], include of seven curves *PLOT Graph 2 a' versus x for 1 (0.5, 1.5, 3.0, 4.5, 6.0, 7.5, 9.0], include of seven curves *PLOT Graph 3 variation of optimal power coefficient C, versus 1 (0.5, 1.5, 3.0, 4.5, 6.0, 7.5, 9.0]
Step by Step Solution
There are 3 Steps involved in it
1 Expert Approved Answer
Step: 1 Unlock

Question Has Been Solved by an Expert!
Get step-by-step solutions from verified subject matter experts
Step: 2 Unlock
Step: 3 Unlock