

Question: Given the question and the solution for parts a, b, c, d, e Solve ONLY parts f, g, and h. a. Weighted moving average forecast
Given the question and the solution for parts a, b, c, d, e Solve ONLY parts f, g, and h.
a. Weighted moving average forecast
Weights are .60, .30, .10
WMAFJuly = .60 * 15 +.3 *16 + .10 * 12 = 15
b. 3-period moving average forecast
MAFJuly = (15 + 16 + 12)/3 = 43/3 = 14.33
c. Exponential smoothing forecast ? = .20, ESFJune = 13
ESFJuly = .20 * 15 + (1-.20) * 13 = 13.4
d. Simple linear regression
| Month | x | y | xy | x2 |
| Jan | 1 | 12 | 12 | 1 |
| Feb | 2 | 11 | 22 | 4 |
| Mar | 3 | 15 | 45 | 9 |
| Apr | 4 | 12 | 48 | 16 |
| May | 5 | 16 | 80 | 25 |
| Jun | 6 | 15 | 90 | 36 |
|
| 21 | 81 | 297 | 91 |
e. Regression forecast x = 7
Y7 = 10.8 + .7714 * 7 = 16.2
Solve ONLY f, g, and h.
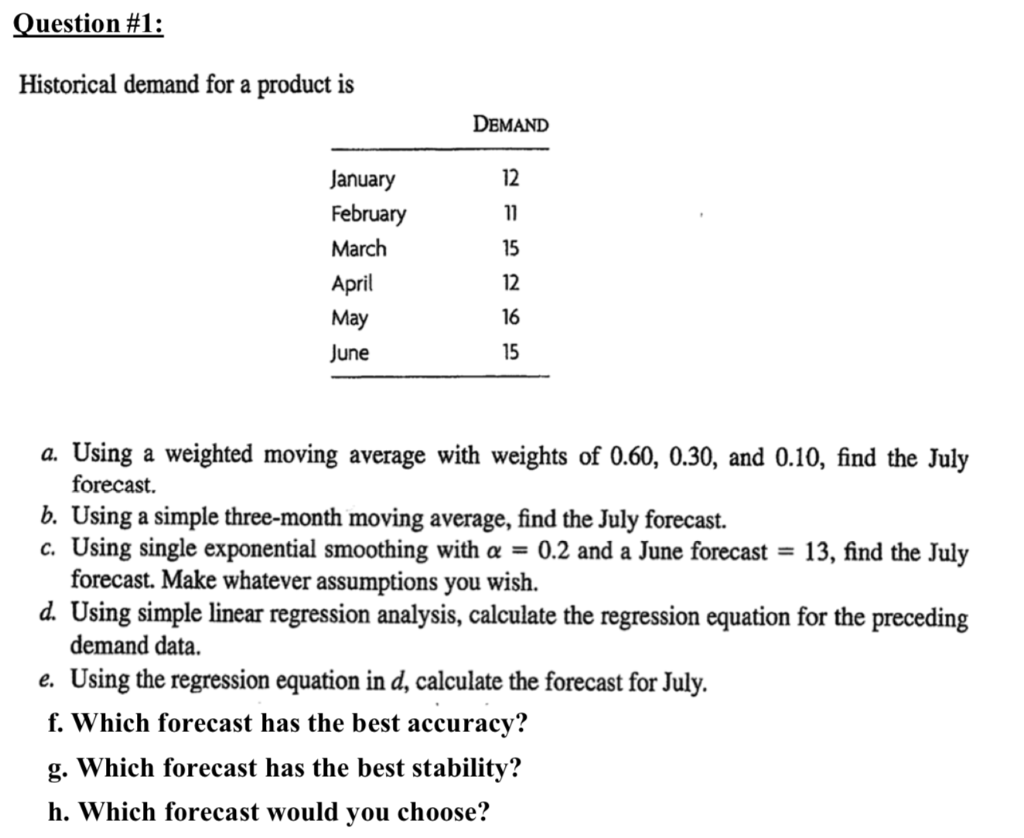
Question #1: Historical demand for a product is DEMAND January February March April May June ASL, a. Using a weighted moving average with weights of 0.60, 0.30, and 0.10, find the July forecast. b. Using a simple three-month moving average, find the July forecast. c. Using single exponential smoothing with a = 0.2 and a June forecast = 13, find the July forecast. Make whatever assumptions you wish. d. Using simple linear regression analysis, calculate the regression equation for the preceding demand data. e. Using the regression equation in d, calculate the forecast for July. f. Which forecast has the best accuracy? g. Which forecast has the best stability? h. Which forecast would you chooseStep by Step Solution
There are 3 Steps involved in it
1 Expert Approved Answer
Step: 1 Unlock

Question Has Been Solved by an Expert!
Get step-by-step solutions from verified subject matter experts
Step: 2 Unlock
Step: 3 Unlock