

Question: Given the table below answer the following Question Table 6 - Sales Budget Qtr. 1 Qtr. 2 Qtr. 3 Qtr. 4 Total SP Per Unit
Given the table below answer the following Question
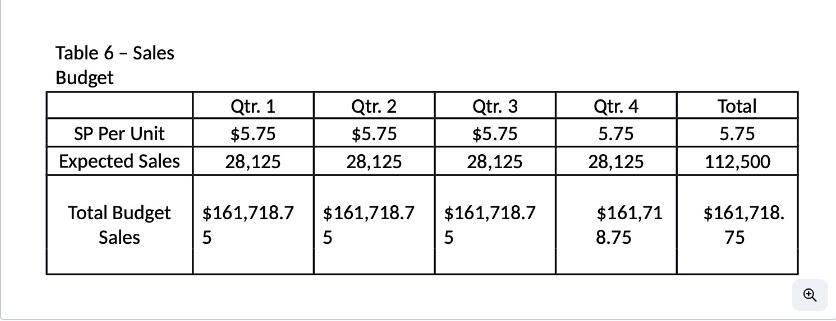
Table 6 - Sales Budget Qtr. 1 Qtr. 2 Qtr. 3 Qtr. 4 Total SP Per Unit $5.75 $5.75 $5.75 5.75 5.75 Expected Sales 28,125 28,125 28,125 28,125 112,500 Total Budget $161,718.7 $161,718.7 $161,718.7 $161,71 $161,718. Sales 5 5 5 8.75 75 @
Step by Step Solution
There are 3 Steps involved in it
1 Expert Approved Answer
Step: 1 Unlock

Question Has Been Solved by an Expert!
Get step-by-step solutions from verified subject matter experts
Step: 2 Unlock
Step: 3 Unlock