

Question: Given the table below answer the question. 2011 2012 Cash Accounts receivable Inventory 200 100 800 1,400 3,600 3,100 Current assets 4,600 4,600 Gross fixed
Given the table below answer the question.
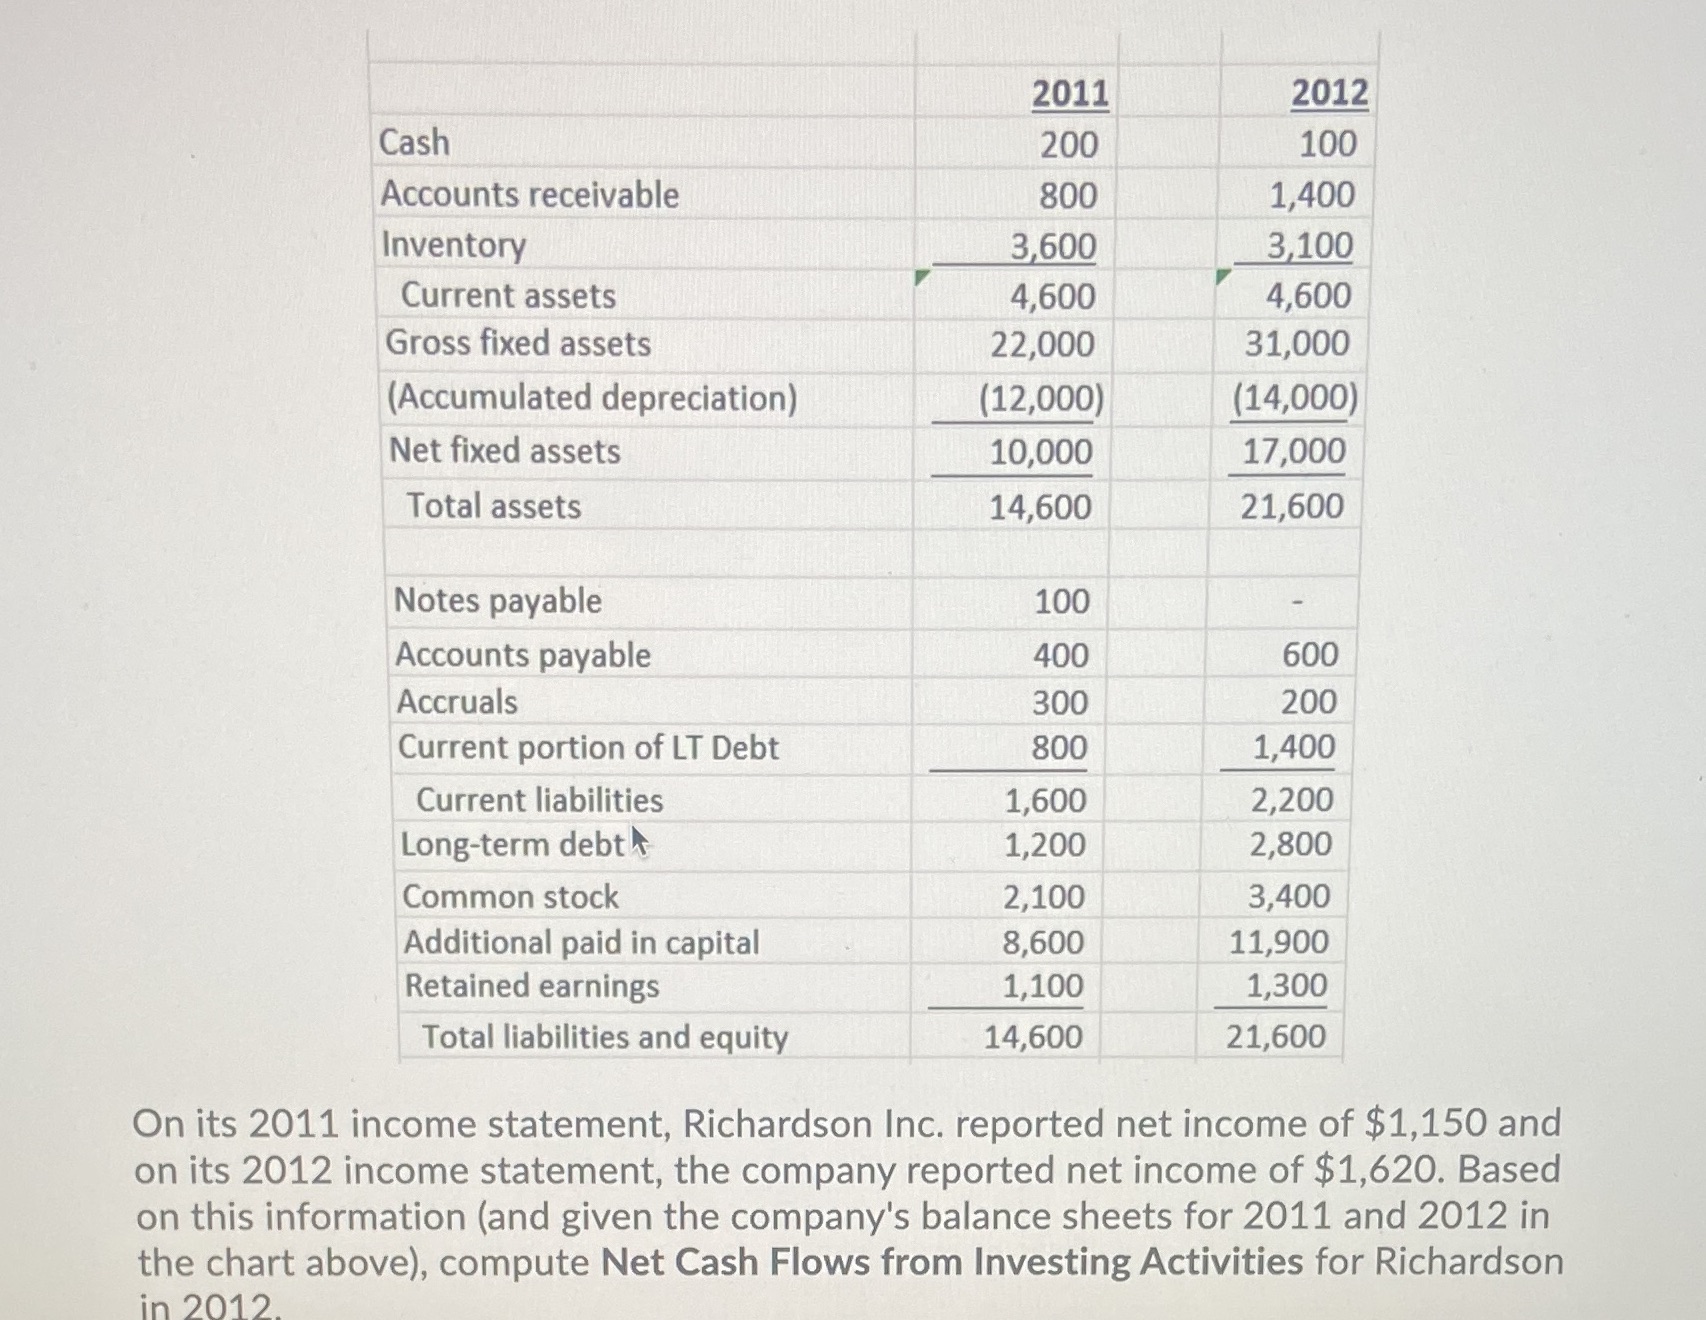
2011 2012 Cash Accounts receivable Inventory 200 100 800 1,400 3,600 3,100 Current assets 4,600 4,600 Gross fixed assets 22,000 31,000 (Accumulated depreciation) (12,000) (14,000) Net fixed assets 10,000 17,000 Total assets 14,600 21,600 Notes payable 100 Accounts payable 400 600 Accruals 300 200 Current portion of LT Debt 800 1,400 Current liabilities 1,600 2,200 Long-term debt 1,200 2,800 Common stock 2,100 3,400 Additional paid in capital 8,600 11,900 Retained earnings 1,100 1,300 Total liabilities and equity 14,600 21,600 On its 2011 income statement, Richardson Inc. reported net income of $1,150 and on its 2012 income statement, the company reported net income of $1,620. Based on this information (and given the company's balance sheets for 2011 and 2012 in the chart above), compute Net Cash Flows from Investing Activities for Richardson in 2012.
Step by Step Solution
There are 3 Steps involved in it
To calculate the Net Cash Flows from Investing Activities for Richardson Inc in 2012 we need to use ... View full answer

Get step-by-step solutions from verified subject matter experts