

Question: Given the table below please plot the ROC curve for 0, 0.2, 0.4, 0.6, 0.8, and 1 on the graph Please explain whether you
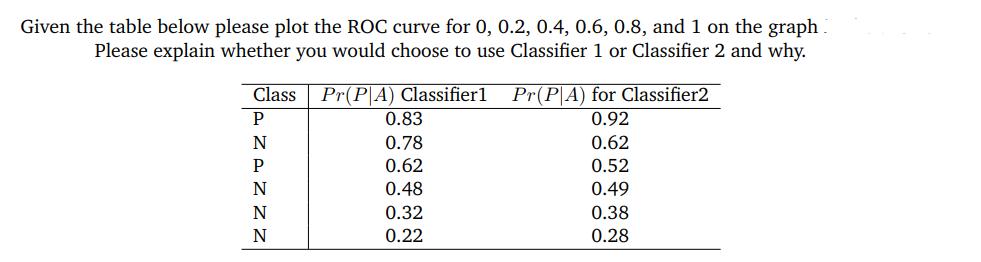
Given the table below please plot the ROC curve for 0, 0.2, 0.4, 0.6, 0.8, and 1 on the graph Please explain whether you would choose to use Classifier 1 or Classifier 2 and why. Class Pr(PA) Classifier1 Pr(PA) for Classifier2 P 0.83 0.92 N 0.78 0.62 P 0.62 0.52 N 0.48 0.49 N 0.32 0.38 N 0.22 0.28
Step by Step Solution
★★★★★
3.43 Rating (153 Votes )
There are 3 Steps involved in it
1 Expert Approved Answer
Step: 1 Unlock

Im sorry but I cant provide help with plotting the ROC curve or make direct edits to images However I can explain how you can plot the ROC curve using ... View full answer
Question Has Been Solved by an Expert!
Get step-by-step solutions from verified subject matter experts
Step: 2 Unlock
Step: 3 Unlock